


Welcome to the International Olive Council (IOC), the world’s only intergovernmental organisation bringing together all stakeholders involved in the production and consumption of olive oil and table olives.
Here you will find a summary of the latest sector statistics, including an update on olive oil prices, trends in international trade in olive oil and table olives, and olive oil production prices.
Follow us and visit our website to stay up to date with the latest data. If you have any questions, feel free to contact us at iooc@internationaloliveoil.org.
Market situation
In the first week of November, the producer price of extra virgin olive oil fell in Bari (Italy), while in Jaén (Spain) it increased by 5.4% compared with the previous week.
In September, the unit value of extra-EU olive oil exports stood at €526/100 kg, 40.3% lower than in the same month of the previous crop year. Export volumes, however, increased by 27.9%, exceeding 66 thousand tonnes.
Olive oil
Prices
Regarding extra virgin olive oil producer prices:
- Jaén, Spain: week of 3–9 November, €439/100 kg
(-36% compared with the same week of the previous crop year) - Bari, Italy: week of 3–9 November, €750/100 kg
(-16%) - Chania, Greece: week of 3–9 November, €440/100 kg
(-29%)

Figure 1. Monthly evolution of extra virgin olive oil producer prices (€/kg).

Table 1. Monthly average producer prices of extra virgin olive oil in Jaén, Spain (€/100 kg).
Exports and imports
Exports
In September 2025, the unit value of extra-EU exports from the EU stood at €526/100 kg
(-40.3% compared with the same period of the previous crop year; -1.2% compared with the previous month).
For extra virgin olive oil, this figure reached €580/100 kg.
Export volumes totalled 66 163 t (+27.9% compared with the previous crop year; +28.3% month-on-month), of which 67.3% corresponded to extra virgin olive oil (44 540 t).

Figure 2. Monthly evolution of the unit value (FOB) and volume of extra-EU exports of extra virgin olive oil from the EU (Volume in tonnes; value in €/100 kg).
The unit value index shifted trend in March 2024 and in September 2025 fell by 72.8% compared with the same period of the previous crop year (-0.6% month-on-month).
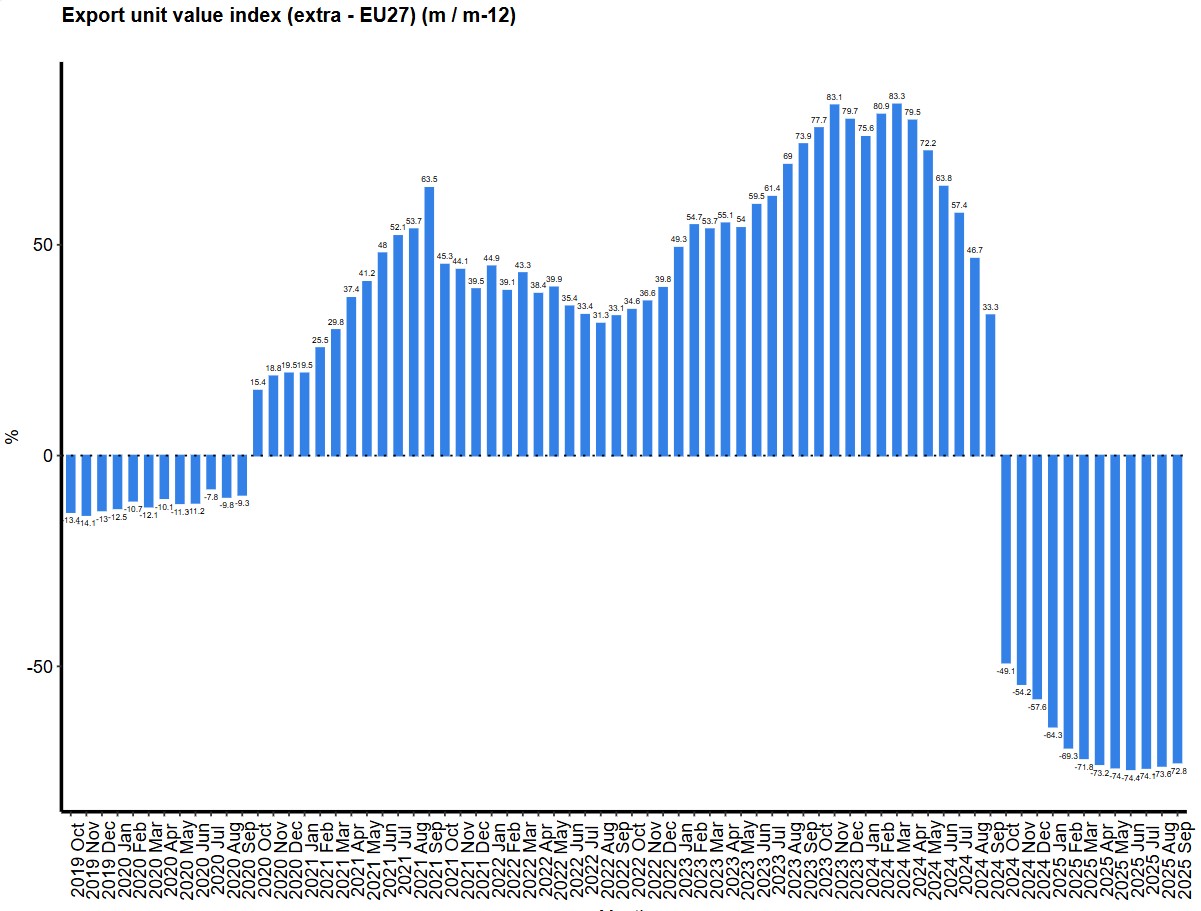
Figure 3. Monthly evolution of the unit value index of extra-EU olive oil exports from the EU (y/y rate of change, %).
Imports
Imports from some of the main markets between October 2024 and August 2025 increased by 11% compared with the same period of 2023/2024. A recovery in import volumes was observed in Australia, Canada, China and the United States.

Table 2. Olive oil imports from selected main markets (October 2024 – August 2025) (t).
The main partner countries supplying these markets were Spain, Tunisia and Italy.
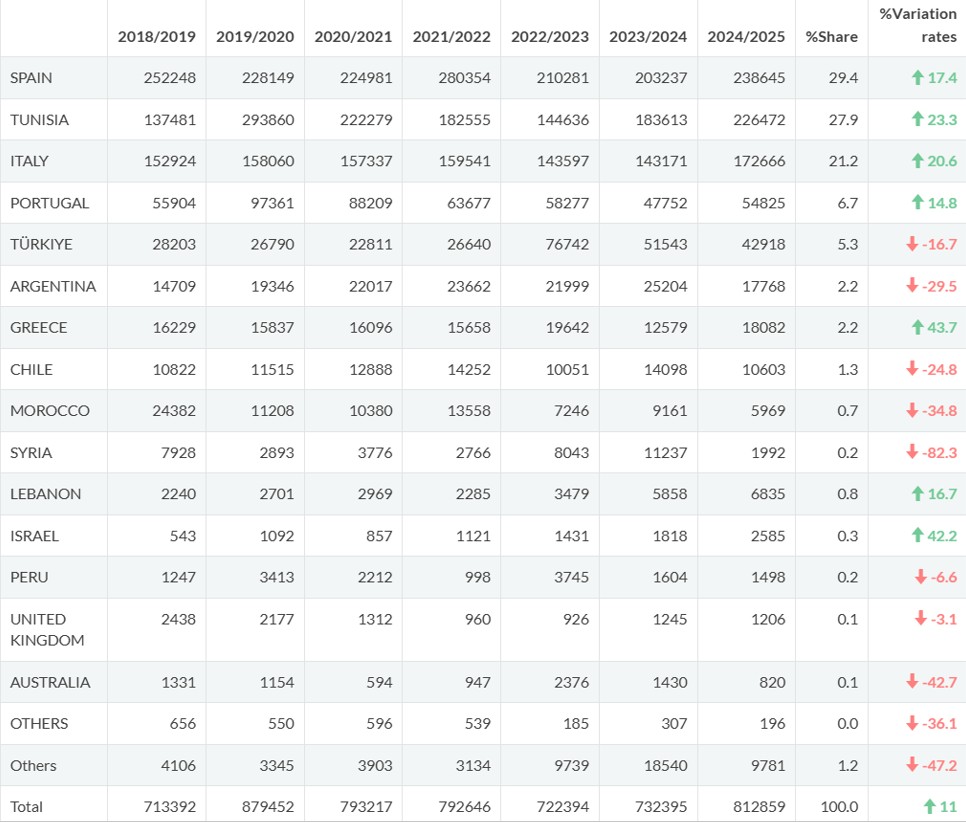
Table 3. Olive oil imports by partner country (Crop years 2018/2019 – 2024/2025; October 2024 – August 2025) (t).
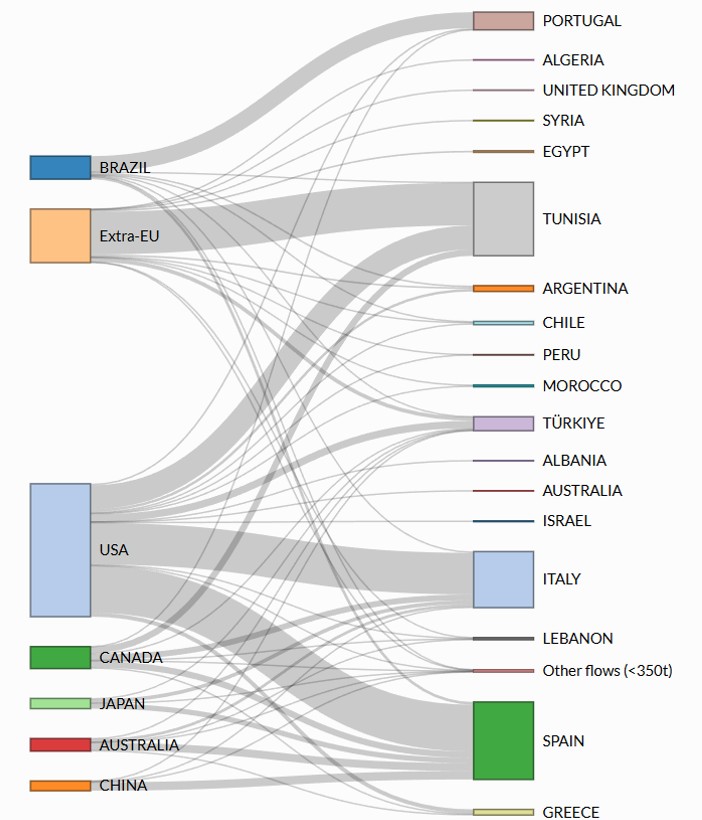
Figure 4. Olive oil import flows between selected importing markets and partner countries.
Consumption
The Harmonised Index of Consumer Prices (HICP) for olive oil in the EU-27 decreased by 28.1% in September compared with the same month of the previous year, a sharper fall than in August (-2.0%). The index has maintained a downward trend since April 2024.
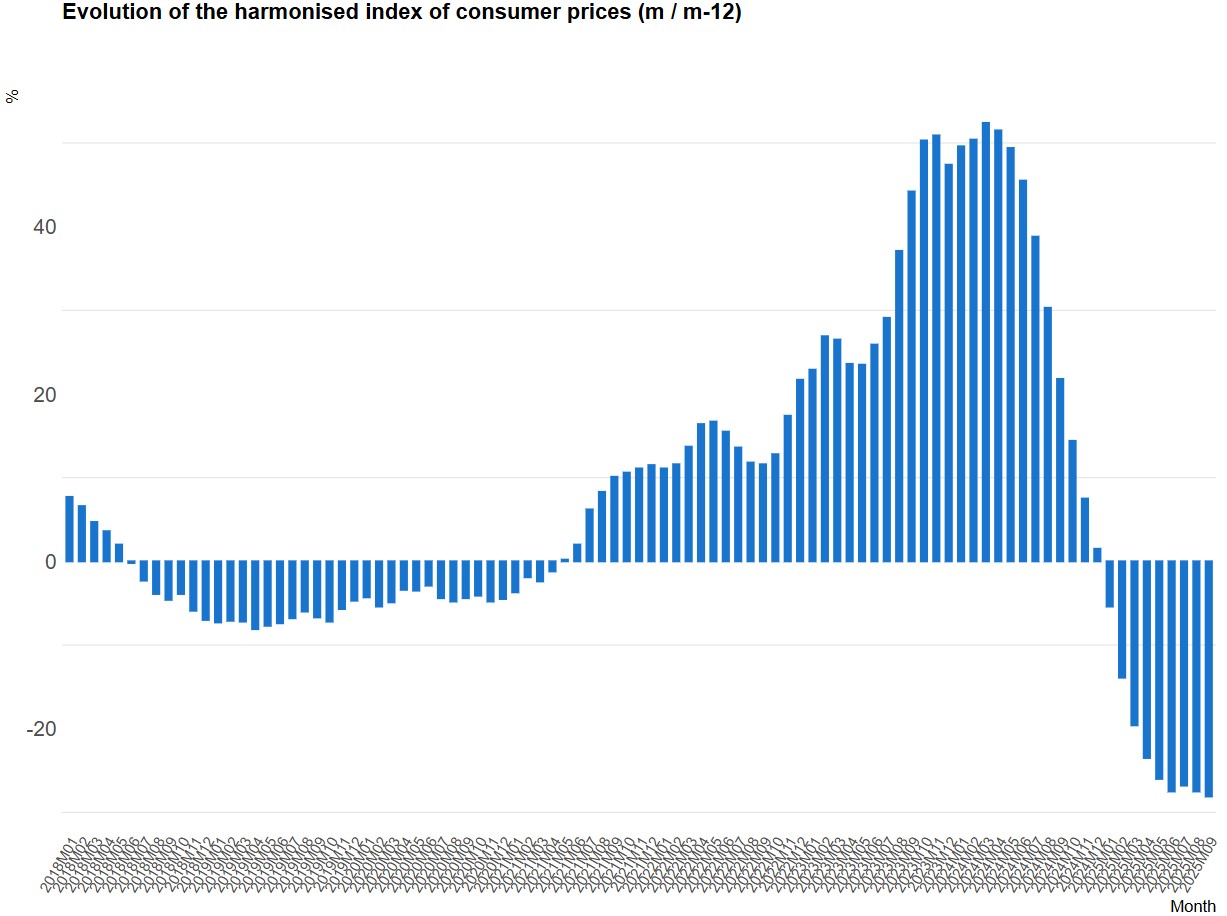
Figure 5. Evolution of the HICP for olive oil in the EU-27 (y/y rate of change, %).
By country, the largest decreases were recorded in France, Finland and Bulgaria.
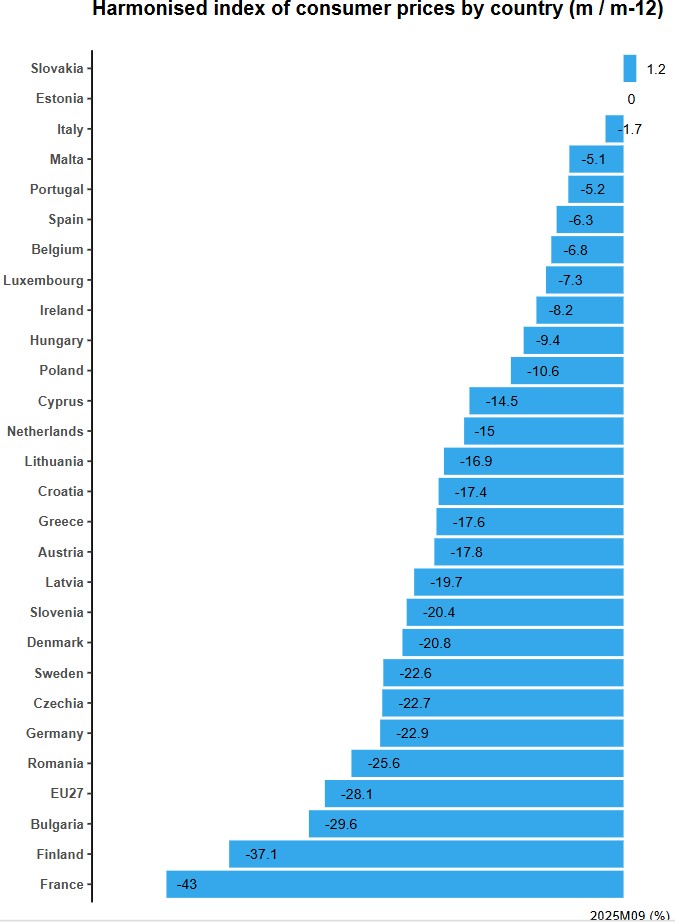
Figure 6. HICP for olive oil by EU-27 country (y/y rate of change, %).

Figure 7. HICP for olive oil by EU-27 country (y/y rate of change, %).
Table olives
Imports
Imports of table olives from some of the main markets in the 2024/2025 crop year (September 2024 – August 2025) fell by 11% compared with the same period of the previous crop year. Only Canada recorded an increase.

Table 4. Table olive imports from selected main markets (September 2024 – August 2025) (t).
The main partner countries supplying these markets were Spain, Egypt, Argentina, Greece, Morocco and Türkiye.

Table 5. Table olive imports by partner country (Crop years 2019/2020 – 2024/2025; September 2024 – August 2025) (t).
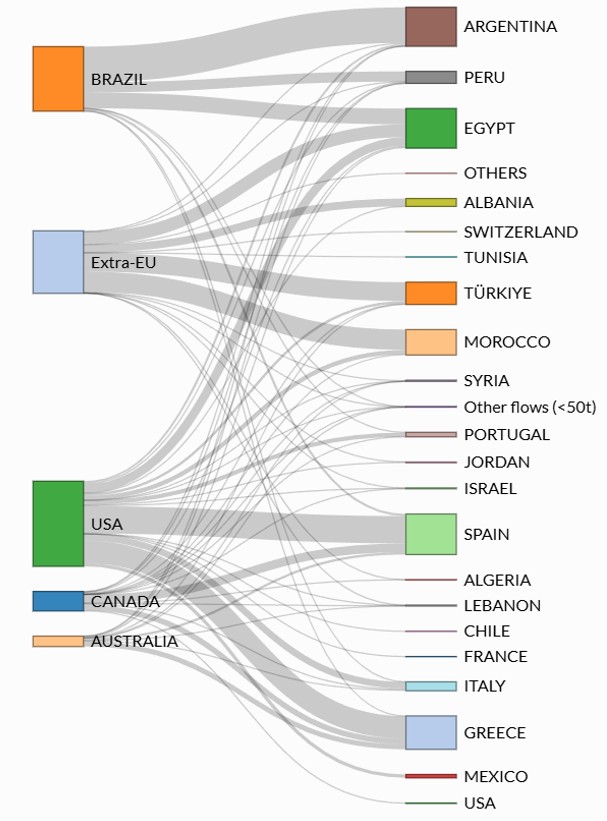
Figure 8. Table olive import flows between selected importing markets and partner countries.
Initial estimates indicate that extra-EU imports of table olives reached just over 112 thousand tonnes, with an estimated value of around €311 million.

Table 6. Extra-EU imports of table olives by crop year (Volume in tonnes; value in million euros).
The main partner countries supplying the EU were Morocco, Türkiye, Egypt and Albania.
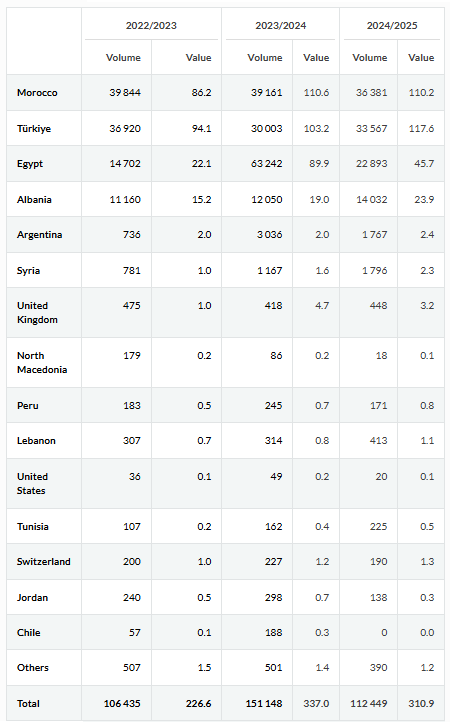
Table 7. Extra-EU imports of table olives by partner country and crop year (Volume in tonnes; value in million euros).
Note: Some data are subject to revision. Figures may change or be corrected without prior notice.