

 Share
Share


Welcome to the International Olive Council (IOC), the only intergovernmental organisation in the world bringing together all stakeholders involved in the production and consumption of olive oil and table olives.
Here you will find a summary of the latest sector statistics, including an update on olive oil prices, international trade trends for olive oil and table olives, and producer prices for olive oil.
Follow us and visit our website to stay up to date with the latest figures. If you have any questions, please do not hesitate to contact us at iooc@internationaloliveoil.org.
Imports
Brazil – Olive oil imports
Brazil’s olive oil imports reached 80,768 tonnes in the 2024/2025 crop year [1], representing a 0.5% decrease compared with the previous crop year. However, during the first six months of the 2025/2026 crop year (October 2025 to March 2026), imports increased by 40.5% compared with the same period of the previous crop year.
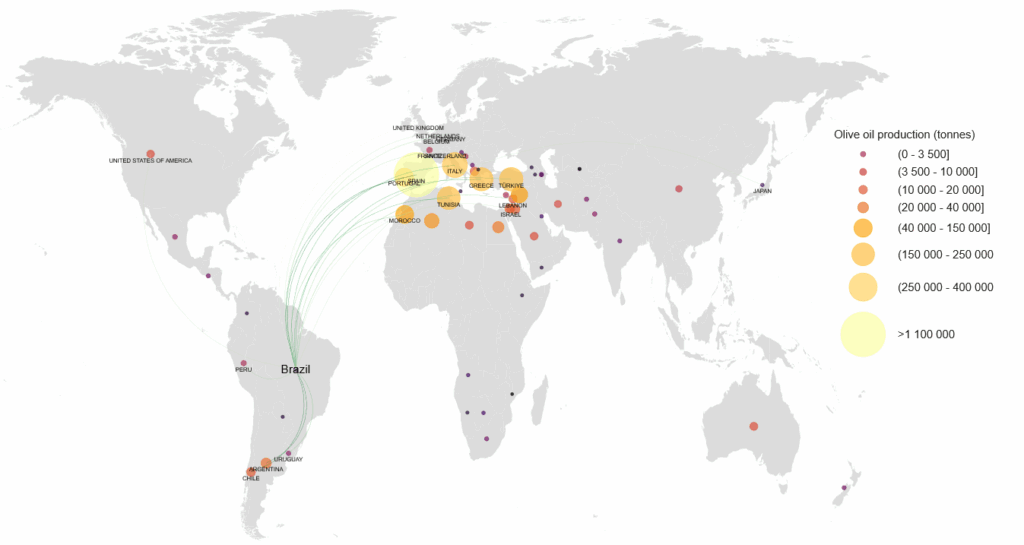
Figure 1. Average olive oil production (2019/2020–2023/2024 crop years) and Brazilian olive oil imports.
Brazil is a predominantly importing market and, with an estimated consumption of 0.4 kg per capita per crop year, accounts on average for around 9% of world olive oil imports and 3.1% of global olive oil consumption.
Although imports declined slightly during the 2024/2025 crop year, the Brazilian market continues to show a strong long-term growth trend. After reaching a low of 50,000 tonnes in the 2015/2016 crop year—31.0% lower than in 2013/2014, mainly as a result of the economic crisis and the depreciation of the Brazilian currency—imports gradually recovered to reach almost 81,000 tonnes in the 2024/2025 crop year.
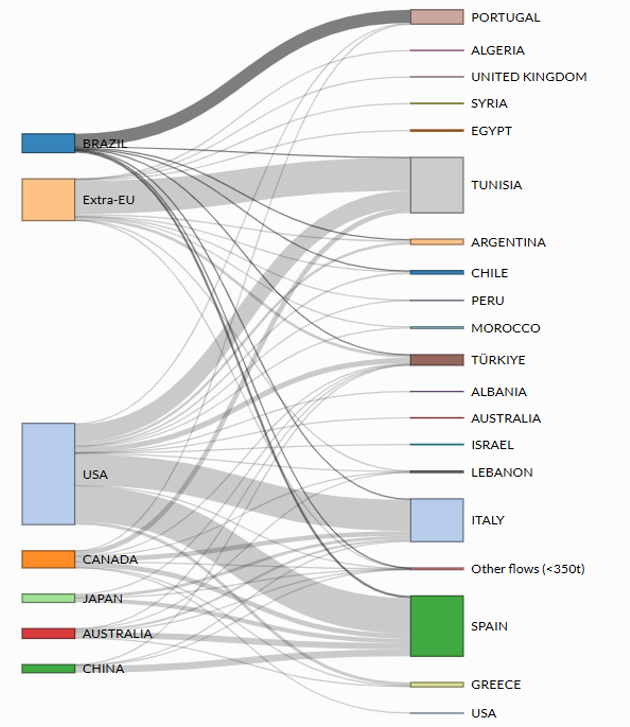
Figure 2. Brazilian olive oil imports by main supplier country (2024/2025).
Portugal remained Brazil’s leading supplier, accounting for 62% of total imports. During the 2024/2025 crop year, imports from Portugal increased by 20.3% compared with the previous crop year.
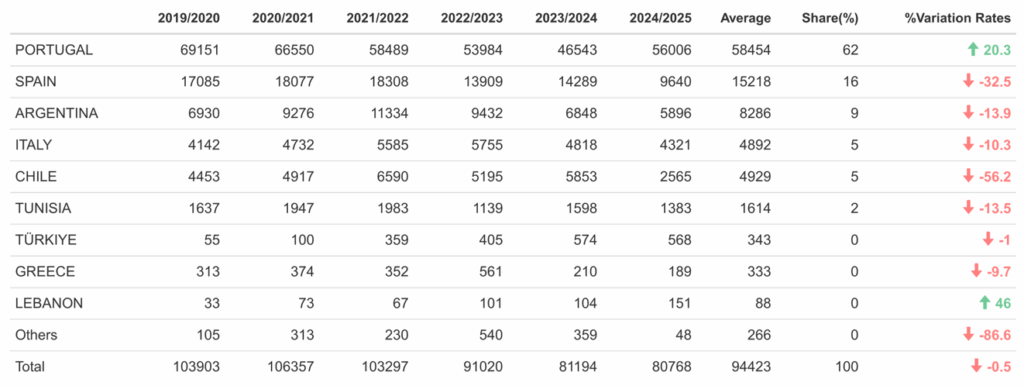
Table 1. Brazilian imports of olive oil and olive-pomace oil by supplier country (2019/2020–2024/2025) (t).
In terms of product categories, virgin olive oils accounted for 85% of total imports. They were followed by olive oils (classified under HS code 15.09.90), representing 14%, while the remaining 1% consisted of olive-pomace oils.
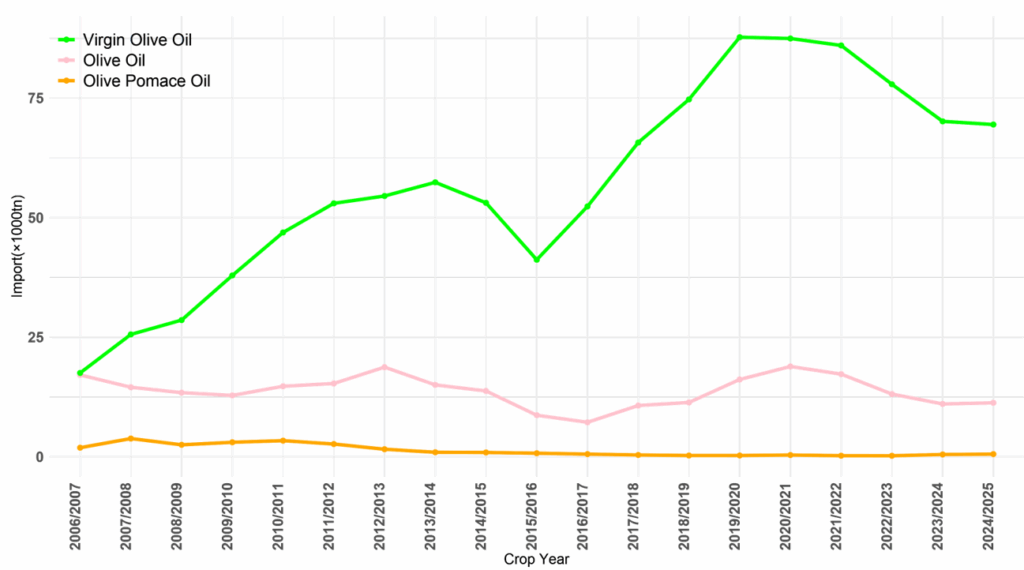
Figure 3. Brazilian imports by product category (2006/2007–2024/2025) (×1,000 t).
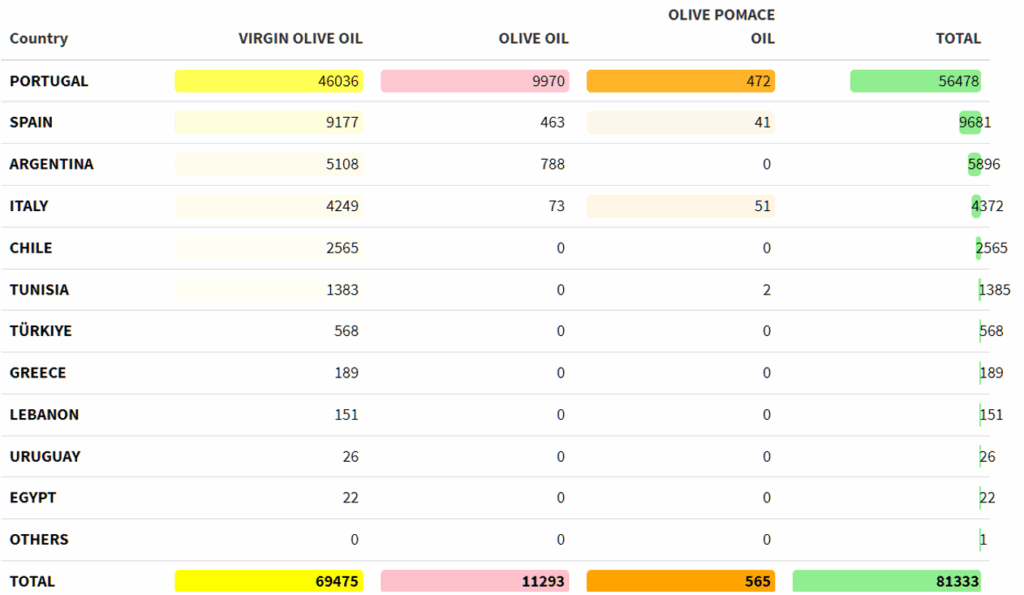
Table 2. Distribution of Brazilian imports by product category and supplier country (2024/2025) (t).
World olive oil imports
Between October 2025 and March 2026, olive oil imports in a selection of major markets increased by 4.3% compared with the same period of the previous crop year. Most markets recorded higher import volumes, with the exception of Canada and the United States.
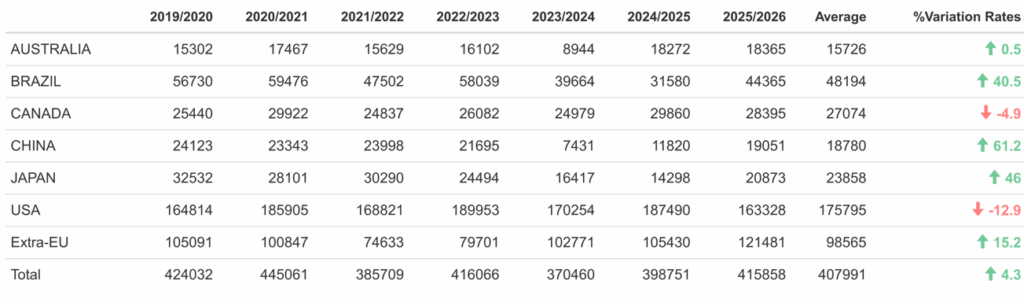
Table 3. Olive oil imports in selected major markets (October 2025–March 2026) (t).
World table olive imports
Imports of table olives in a selection of major markets increased by 5.6% between September 2025 and March 2026, compared with the same period of the 2024/2025 crop year.
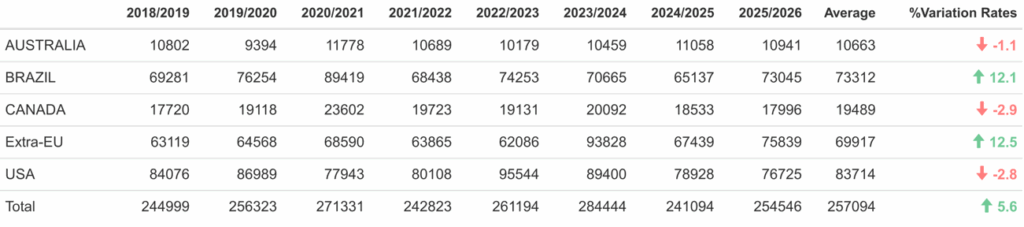
Table 4. Table olive imports in selected major markets (September 2025–March 2026) (t).
Prices
Regarding extra virgin olive oil producer prices:
- Jaén (Spain): during the week of 15–21 June, the price stood at € 378.5/100 kg, 7.5% higher than during the corresponding week of the previous crop year.
- Bari (Italy): during the week of 18–24 May, the price reached € 565/100 kg, representing a 41.8% decrease compared with the corresponding period of the previous year.
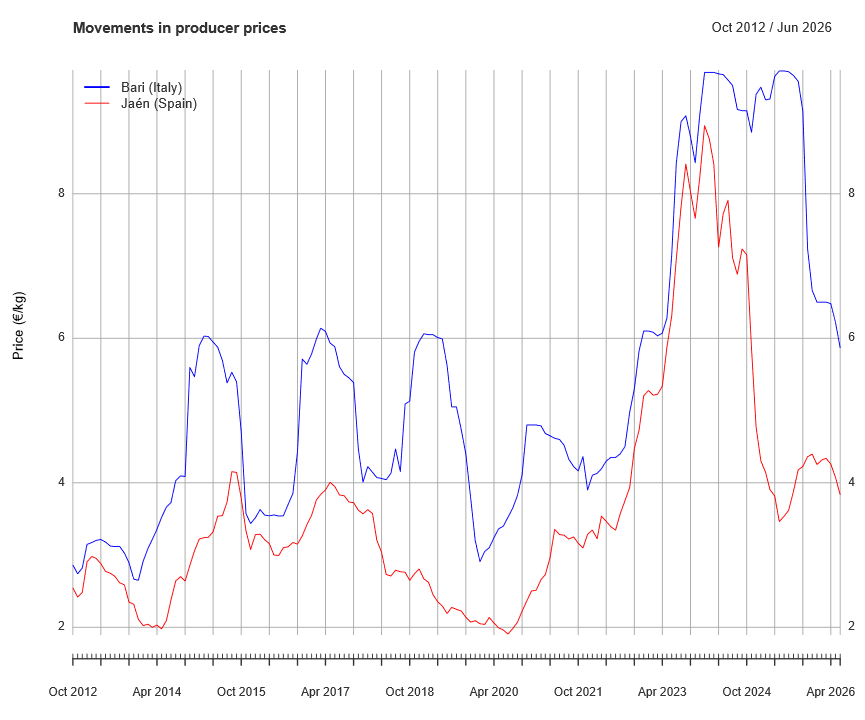
Figure 4. Monthly evolution of extra virgin olive oil producer prices.
Some data are subject to revision. Figures may be amended or corrected without prior notice.
[1] Provisional data