


Welcome to the IOC, the only intergovernmental organisation in the world that brings together all stakeholders involved in the production and consumption of olive oil and table olives.
Here you will find a summary of the latest sector statistics, including an update on olive oil prices, international trade trends for olive oil and table olives, and olive oil production prices.
Follow us and visit our website to stay informed about the latest data. Feel free to email us if you have any questions (iooc@internationaloliveoil.org).
UNITED STATES: OLIVE OIL AND TABLE OLIVE IMPORTS
In June 2025, olive oil imports by the United States doubled compared to the same month of the previous crop year, reaching 66,049 tonnes—the highest figure recorded in the historical series. In contrast, table olive imports fell slightly by 0.5 % over the same period.
-
OLIVE OIL
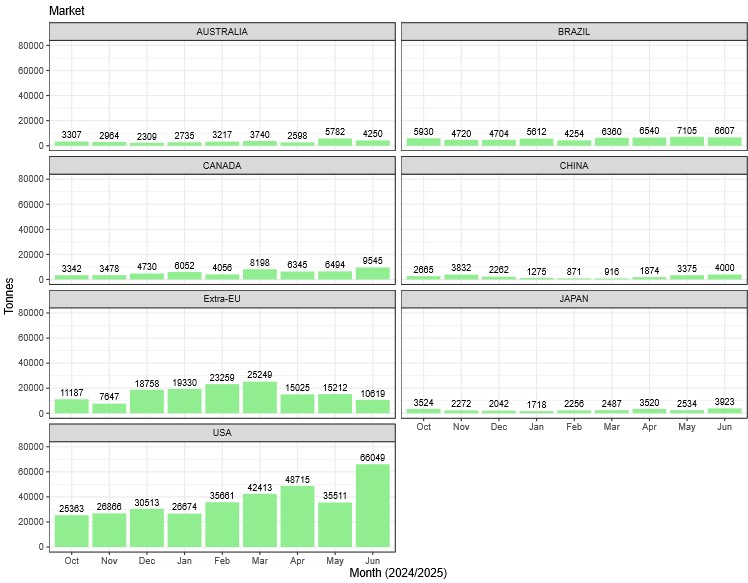
Graph 1 – Evolution of olive oil imports from selected major markets (2024/2025) (tonnes)
In June 2025, the United States imported 66,049 tonnes of olive oil, an increase of 98.7 % compared to the same month of the previous year.
Italy, Spain, Tunisia and Türkiye accounted for nearly 95 % of the total volume imported.
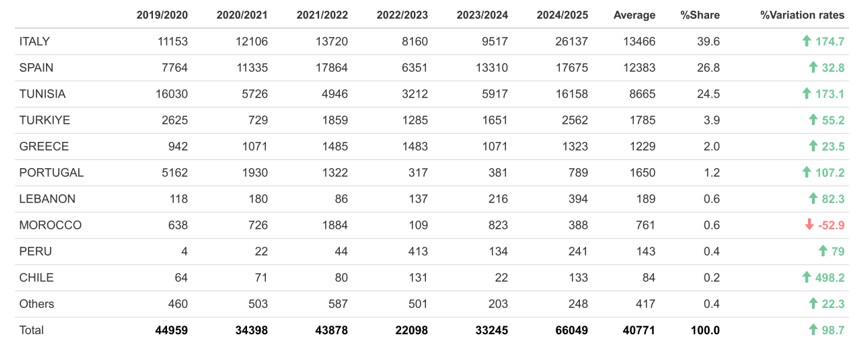
Table 1 – Olive oil imports by partner country (June 2019/2020 – 2024/2025) (tonnes)
In terms of packaging, Italy stands out for exporting mainly in containers of less than 18 kg. Larger containers accounted for less than 6 % of the total.
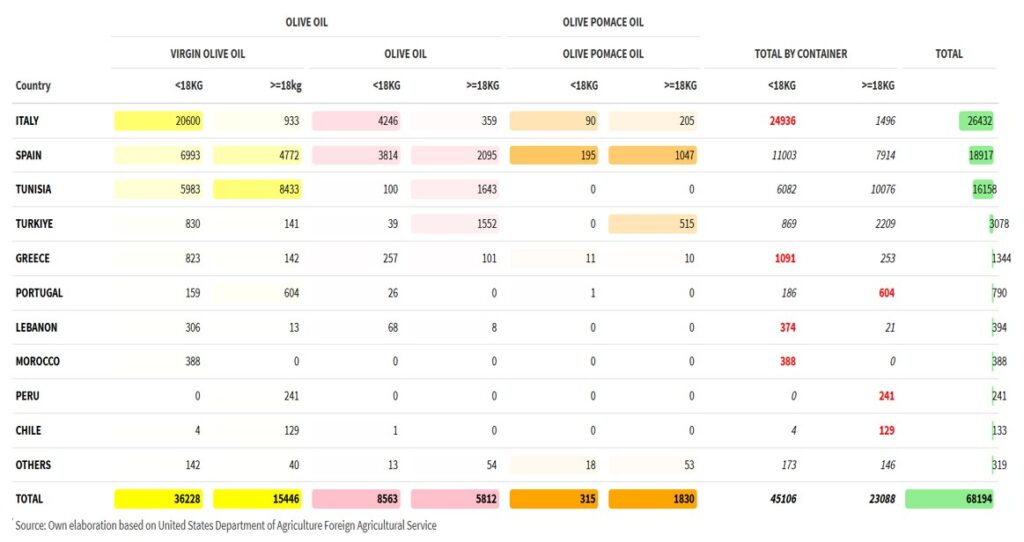
Table 2 – Imports by product type, packaging and partner country (June 2024/2025) (tonnes)
The European Union (EU) remains the leading supplier of olive oil to the United States. In June 2025, the unit value of EU exports was €521.7/100 kg (-48.3 % year-on-year; -5.5 % month-on-month). For extra virgin olive oil, the value was €569.1/100 kg, representing 72 % of total olive oil exports to the US.
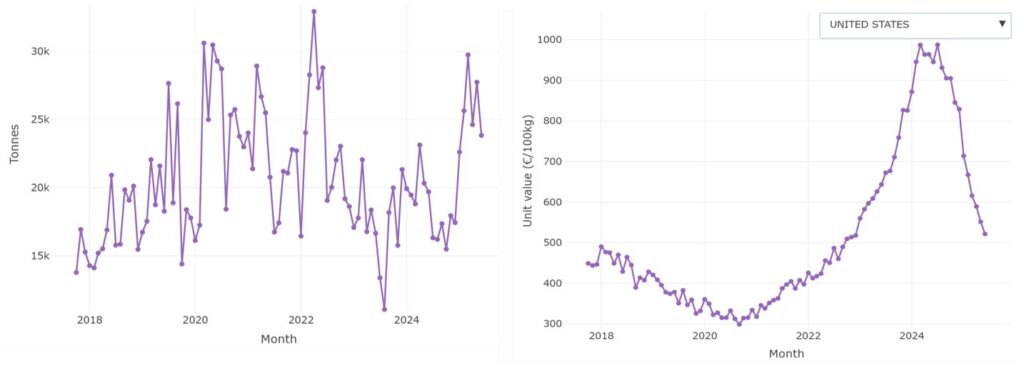
Graph 2 – Monthly evolution of the unit value (FOB) and volume of EU olive oil exports to the United States (volume in tonnes; value in €/100 kg)
-
TABLE OLIVES
Table olive imports by the United States fell by 0.5 % in June 2025 compared to the same month of the previous crop year. From September 2024 to June 2025, total imports declined by 9 %.
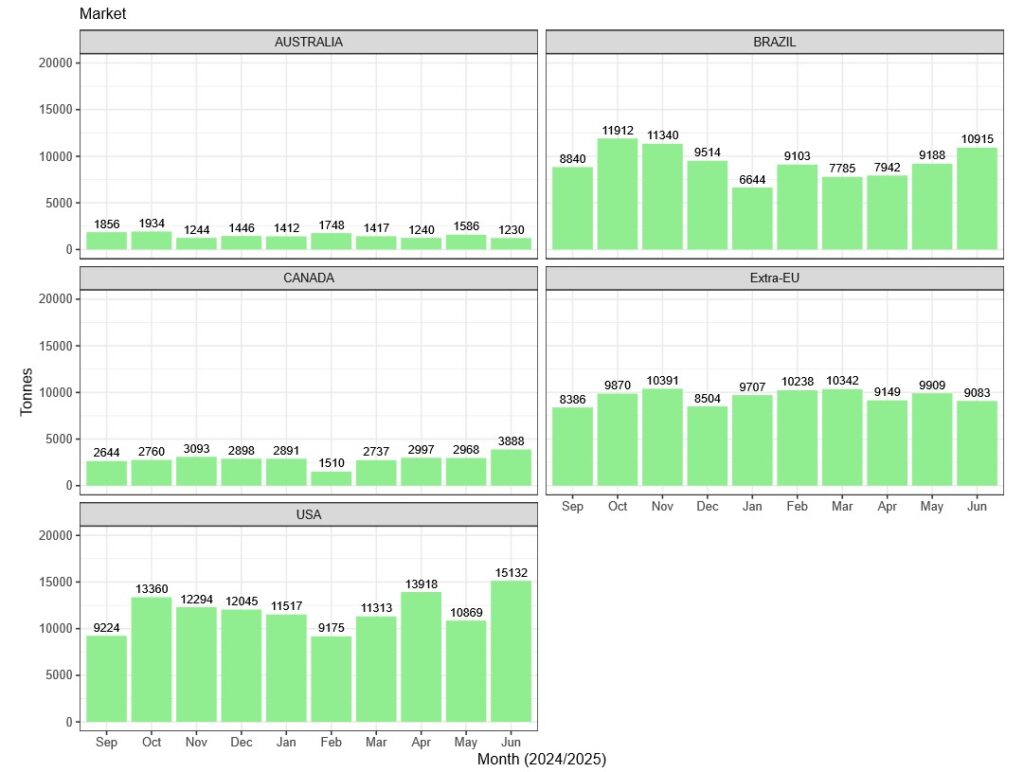
Graph 3 – Evolution of table olive imports from selected major markets (2024/2025) (tonnes)
Spain, Greece, Italy and Egypt accounted for 82 % of total US table olive imports in June.
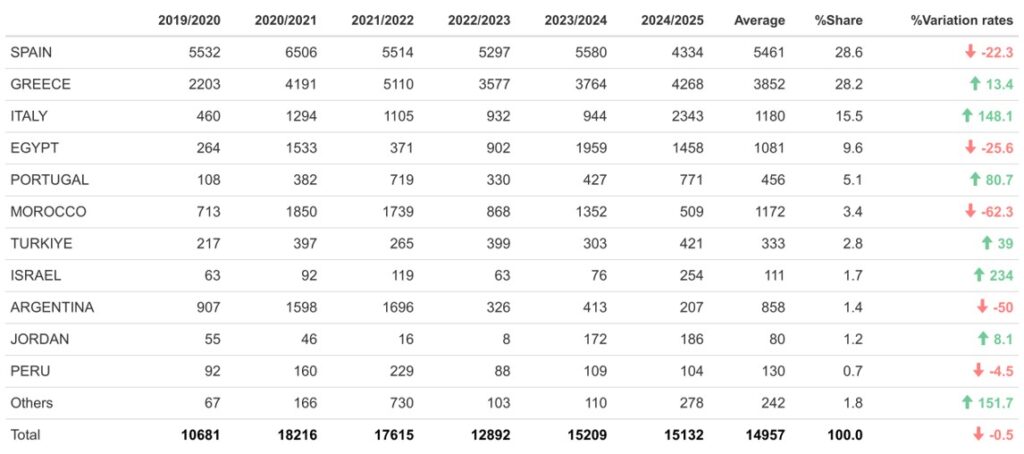
Table 3 – Table olive imports by partner country (2019/2020 – 2024/2025) (tonnes)
PRODUCER PRICES
In the week of 18–24 August 2025, the producer price of extra virgin olive oil in Jaén (Spain) was €386.7/100 kg, a 46 % drop compared to the same week of the previous year.
In Bari (Italy), the price was €970/100 kg during the week of 7–13 July (+19 %), while in Chania (Greece) it was €380/100 kg during the week of 14–20 July (‑41 %).
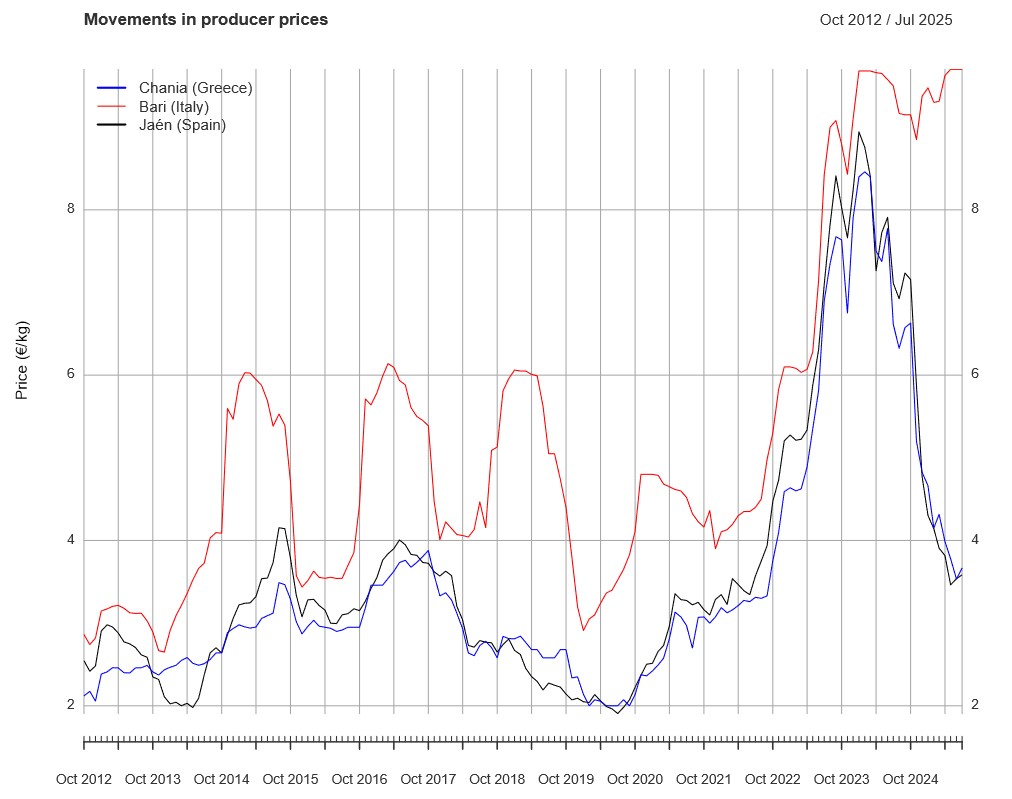
Graph 4 – Monthly evolution of extra virgin olive oil producer prices (€/100 kg)
EXPORTS AND IMPORTS
-
OLIVE OIL EXPORTS
In June 2025, the unit value of EU extra-EU olive oil exports stood at €537/100 kg (‑43.1 % year-on-year; ‑3.1 % month-on-month). For extra virgin olive oil, it was €587.4/100 kg.
Total exports amounted to 67,483 tonnes (+30.4 % year-on-year; ‑10 % month-on-month), of which 70.7 % (47,681 t) were extra virgin.
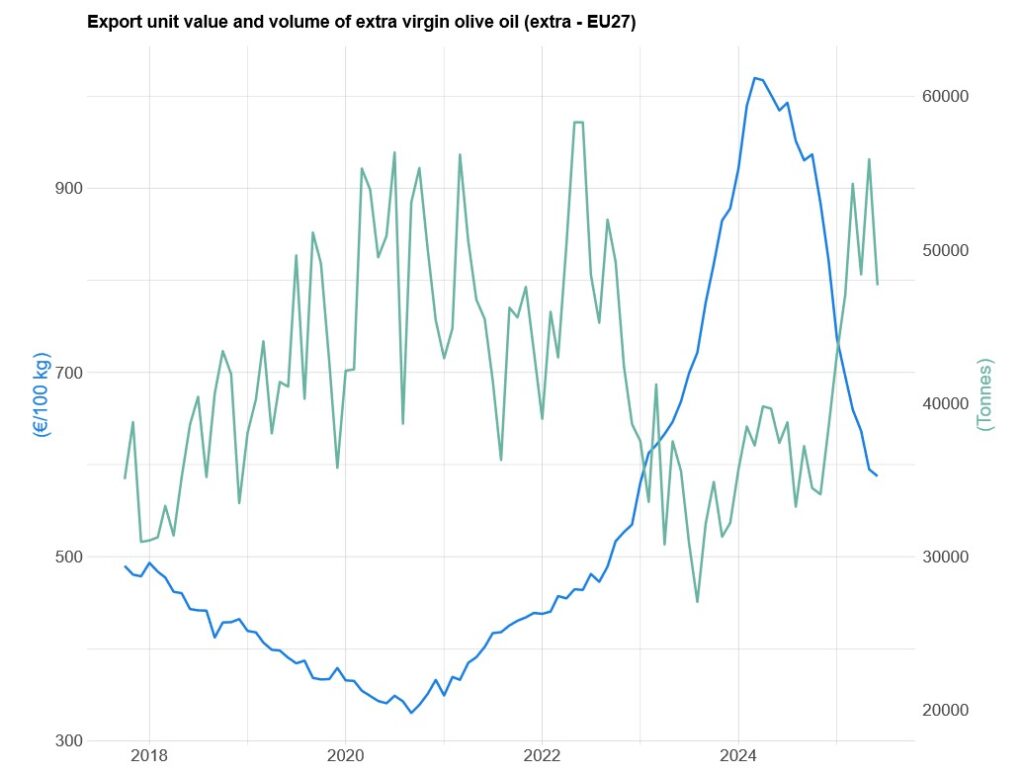
Graph 5 – Monthly evolution of the unit value (FOB) and volume of EU extra-EU exports of extra virgin olive oil (volume in tonnes; value in €/100 kg)
The unit value index continued the downward trend observed since March 2024, falling by 72.9 % year-on-year and 2.4 % compared to May.
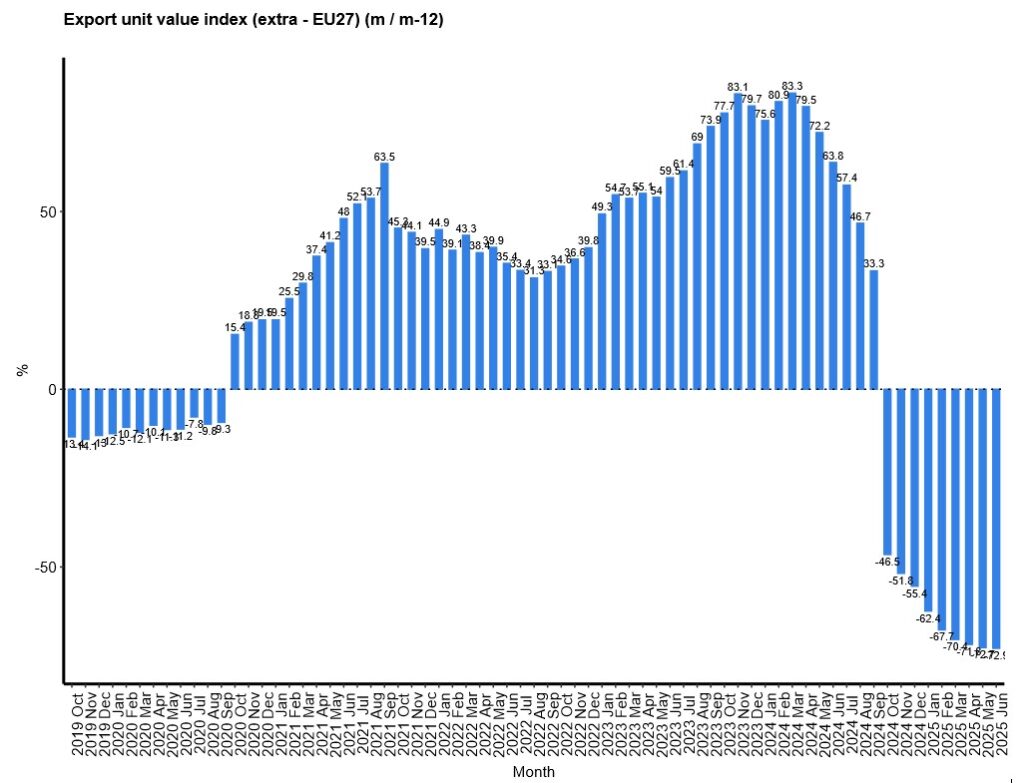
Graph 6 – Monthly evolution of the unit value index for EU extra-EU exports of olive oil (m/m-12 variation rate, %)
-
OLIVE OIL IMPORTS
Between October 2024 and June 2025, olive oil imports from selected major markets increased by 11.4 % compared to the same period of the previous crop year. Notable recovery was observed in volumes from Australia, Canada, China and the United States.
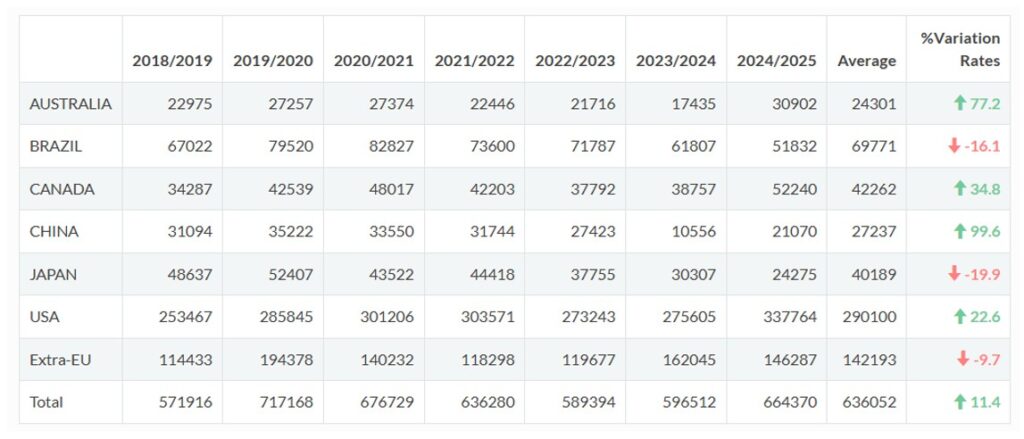
Table 4 – Olive oil imports from selected major markets (volume in tonnes)
-
TABLE OLIVES
In the same period (September 2024 to June 2025), table olive imports from major markets fell by 15.4 % compared to the previous crop year. All markets recorded declines except Canada.
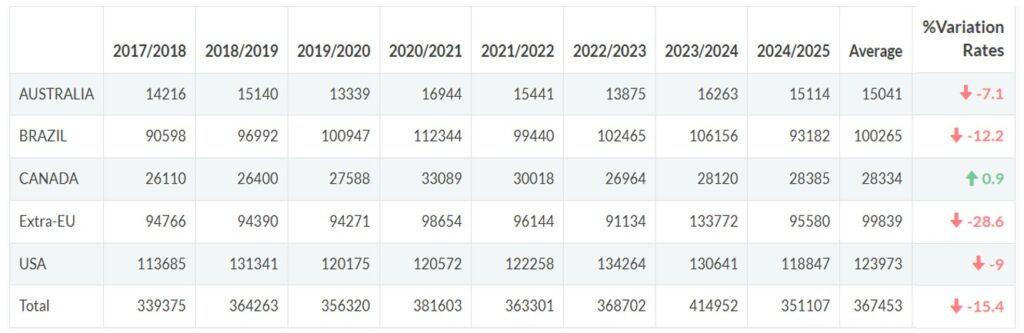
Table 5 – Table olive imports from selected major markets (volume in tonnes)
Egypt, Spain, Argentina, Greece, Morocco and Türkiye were the main suppliers.
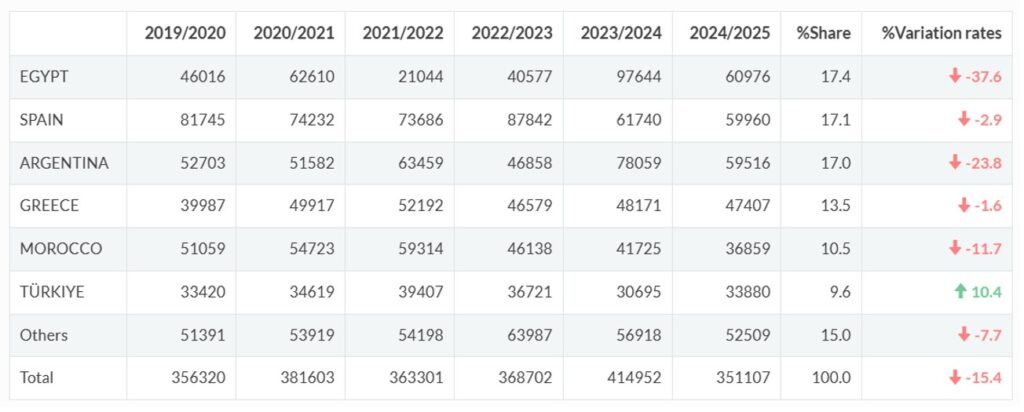
Table 6 – Table olive imports by partner country (2019/2020 – 2024/2025) (tonnes)
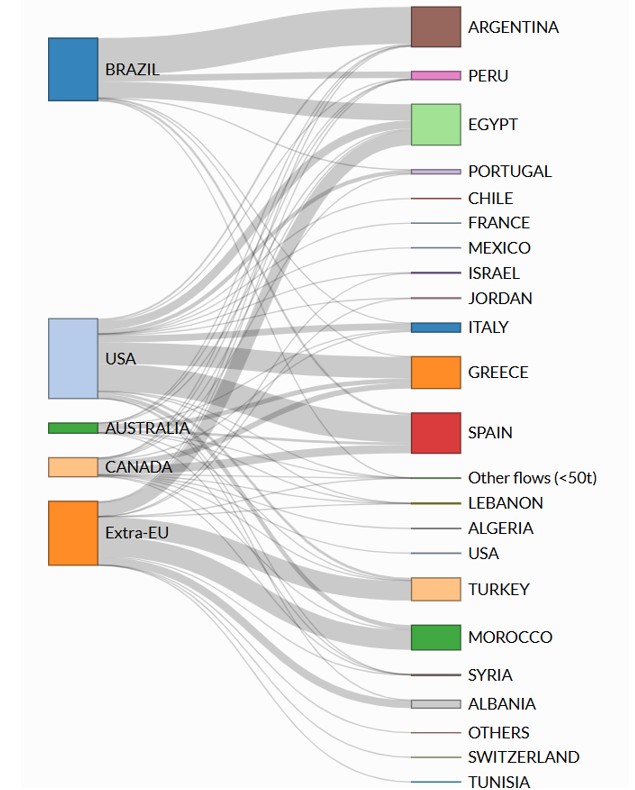
Graph 7 – Table olive import flows between selected major markets and partner countries
Note: Some of the data presented are provisional and may be subject to revision. Figures may be updated or corrected without prior notice.