


Welcome to the IOC, the only intergovernmental organisation in the world that brings together all stakeholders involved in the production and consumption of olive oil and table olives.
Here you will find a summary of the latest sector statistics, including an update on olive oil prices, international trade trends for olive oil and table olives, and olive oil production prices.
Follow us and visit our website to stay informed about the latest data. Feel free to email us if you have any questions (iooc@internationaloliveoil.org).
Production and International Trade
A focus on the Brazilian olive oil market
Prices remain stable as the market awaits the first production forecasts for the 2025/2026 crop year. In the first week of July, the producer price of extra virgin olive oil in Jaén (Spain) increased by 0.4% compared to the previous week.
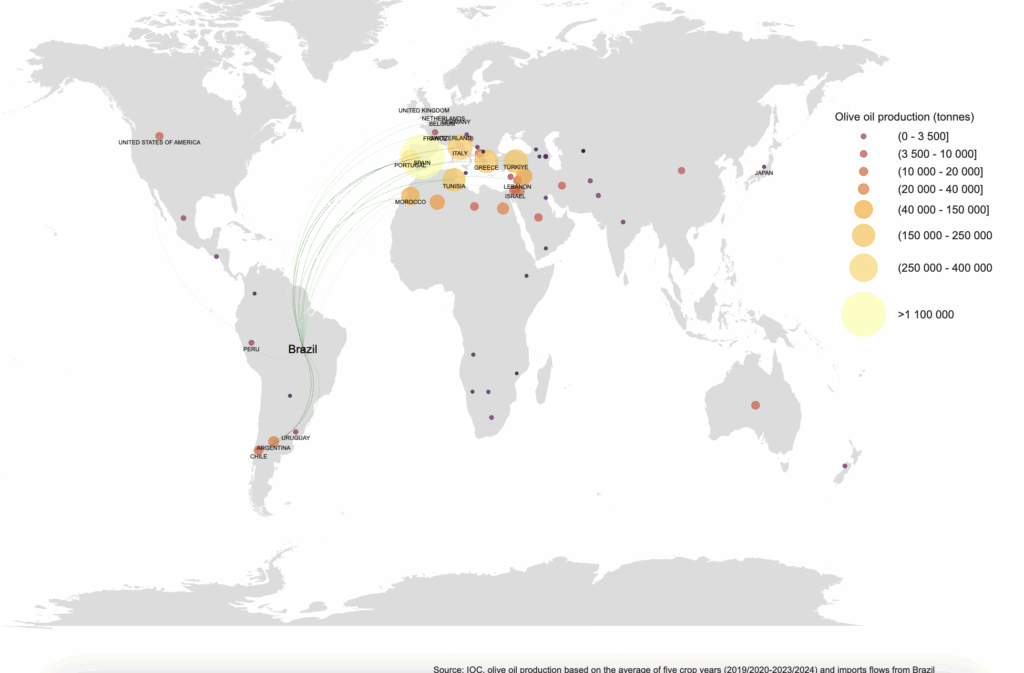
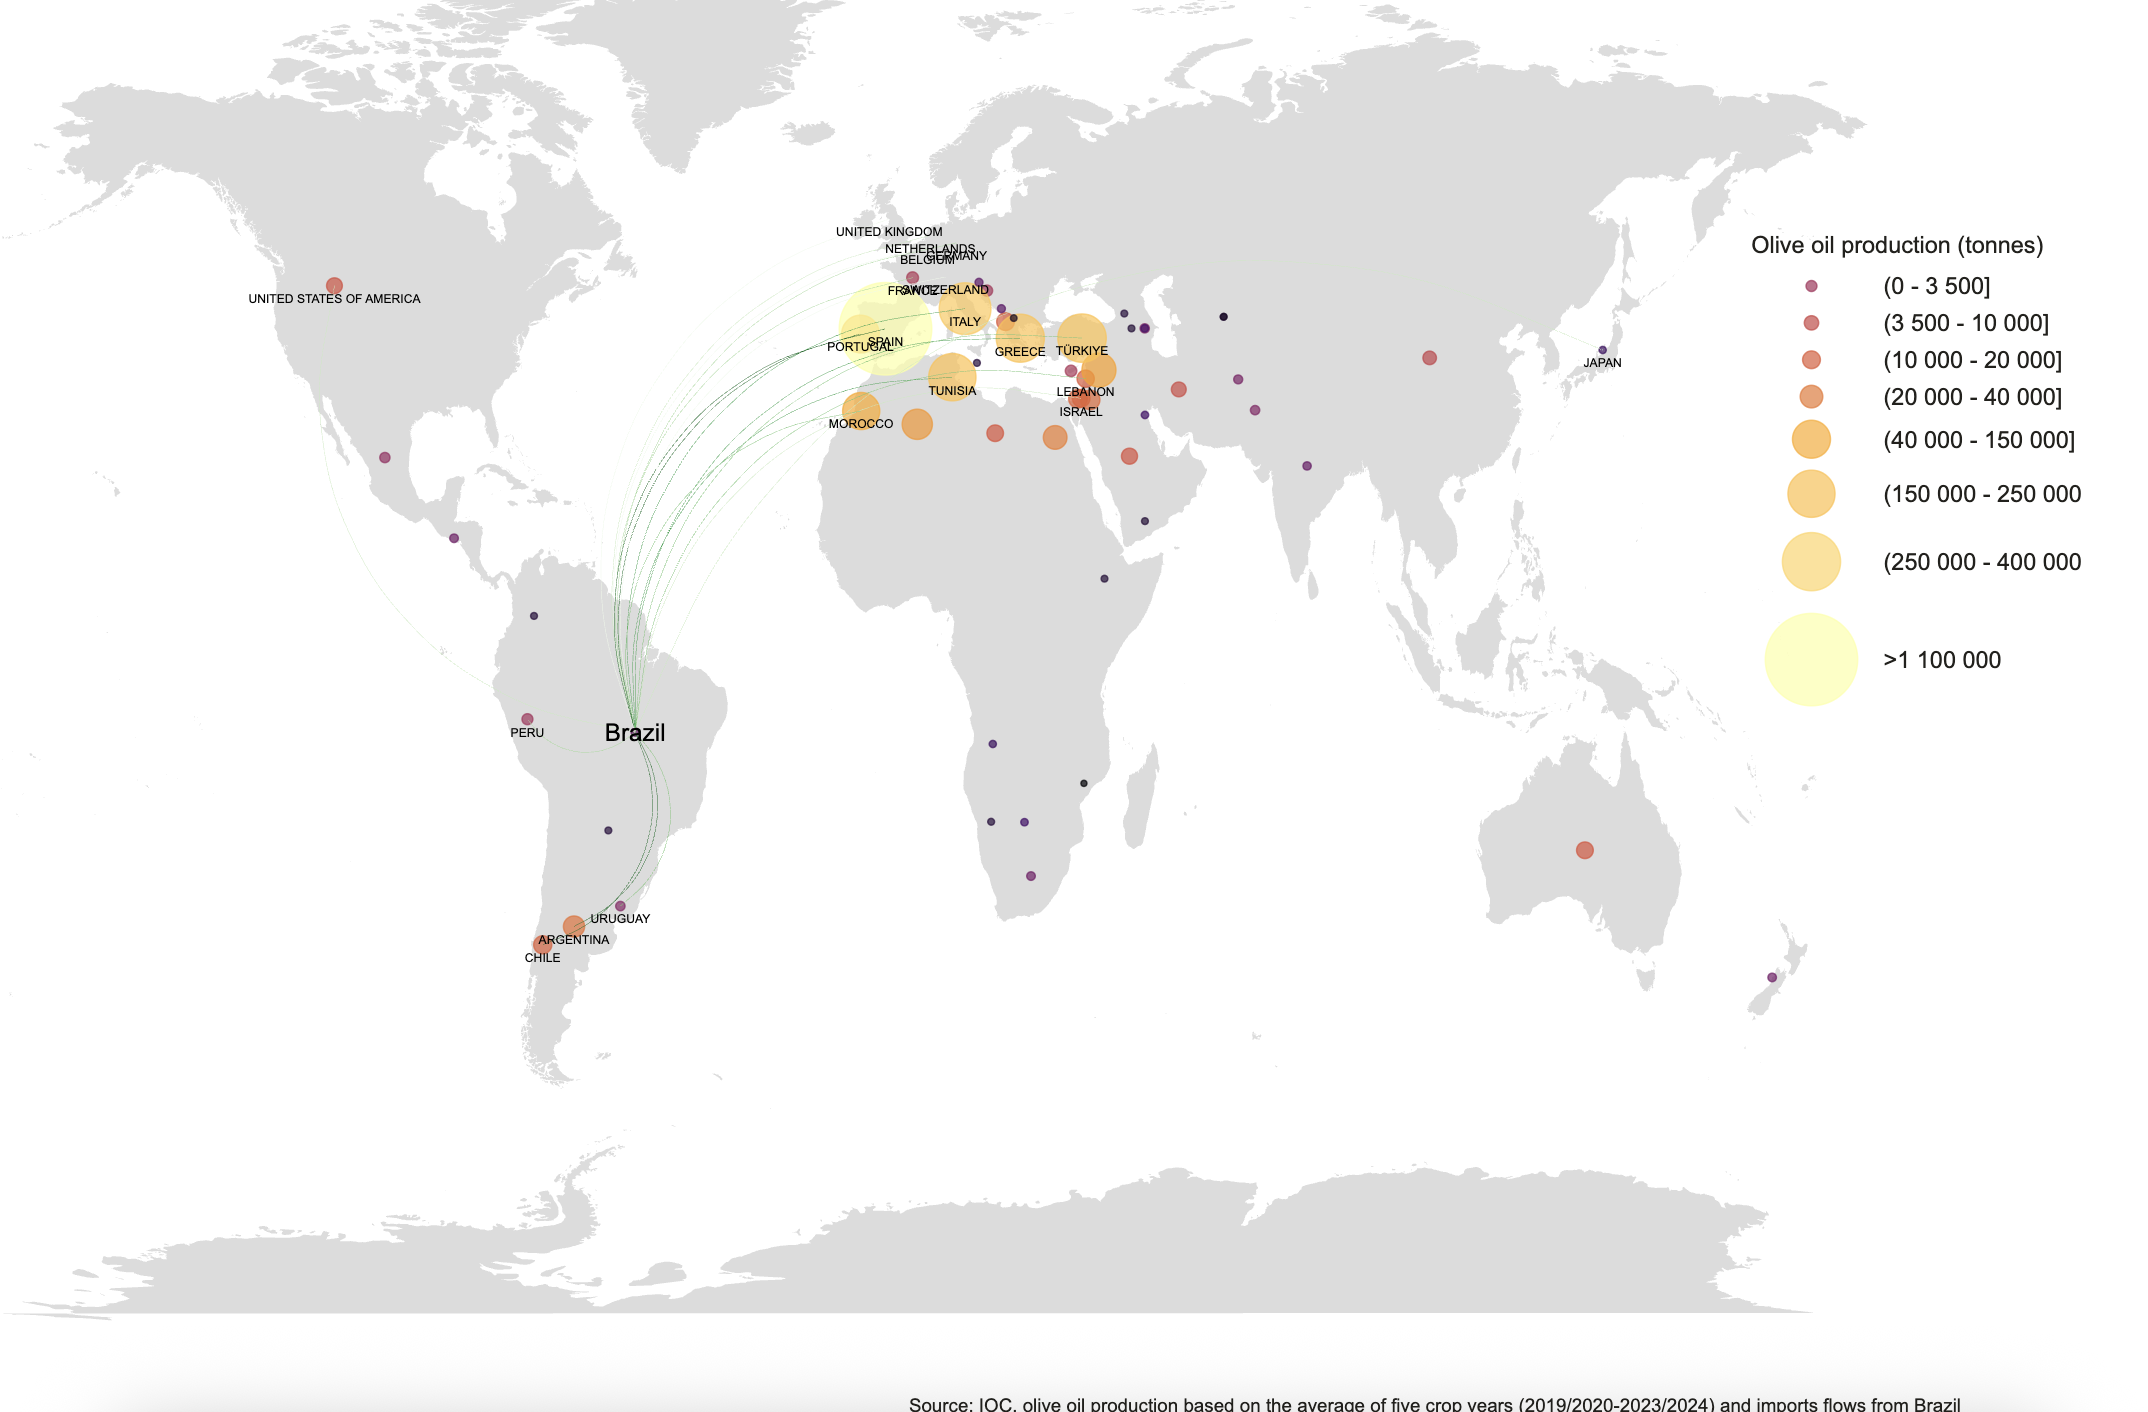
Graph 1: Average olive oil production (2018/2019 to 2023/2024 crop years) and import flows from Brazil.
Brazil, a predominantly importing country, accounts on average for 9% of global olive oil imports and 3.1% of global consumption, with a per capita consumption of just 0.4 kg per crop year. Although olive oil imports fell by 11% in 2023/24, totalling 81,000 t, the Brazilian market experienced steady growth between the 2015/16 and 2021/22 crop years. The lowest level was recorded in 2015/16 with 50,000 t—31% less than in 2013/14—due to the economic crisis and currency devaluation. The most recent decline is mainly attributed to the rise in producer prices.
Portugal remains Brazil’s main supplier, with a 57% market share, although its exports fell by 14% compared to the previous crop year.
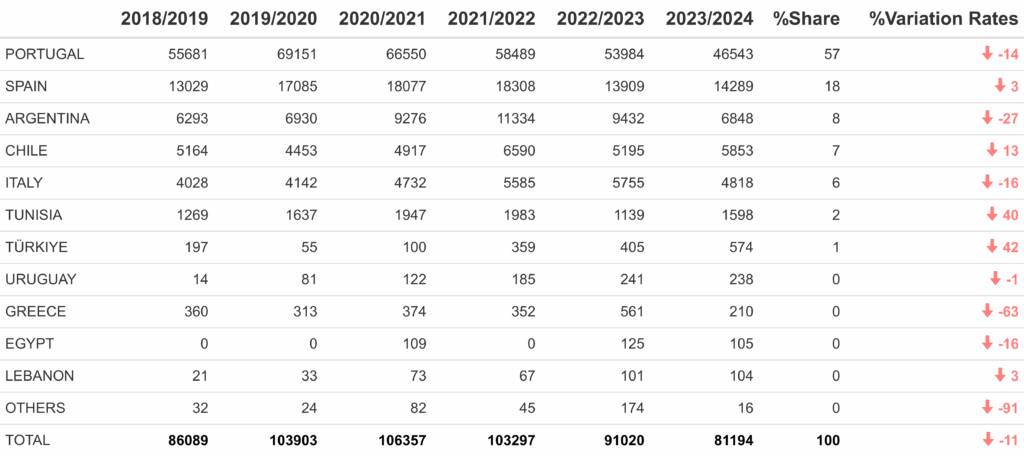
Table 1 – Olive oil imports by partner country (2018/19 – 2023/24) (volume in tonnes)
By product category, 85.9% of imports were virgin olive oils, 13.5% were other olive oils, and 0.6% were olive-pomace oils. Despite a generally positive trend in virgin olive oil imports, a decline has been observed in recent crop years.
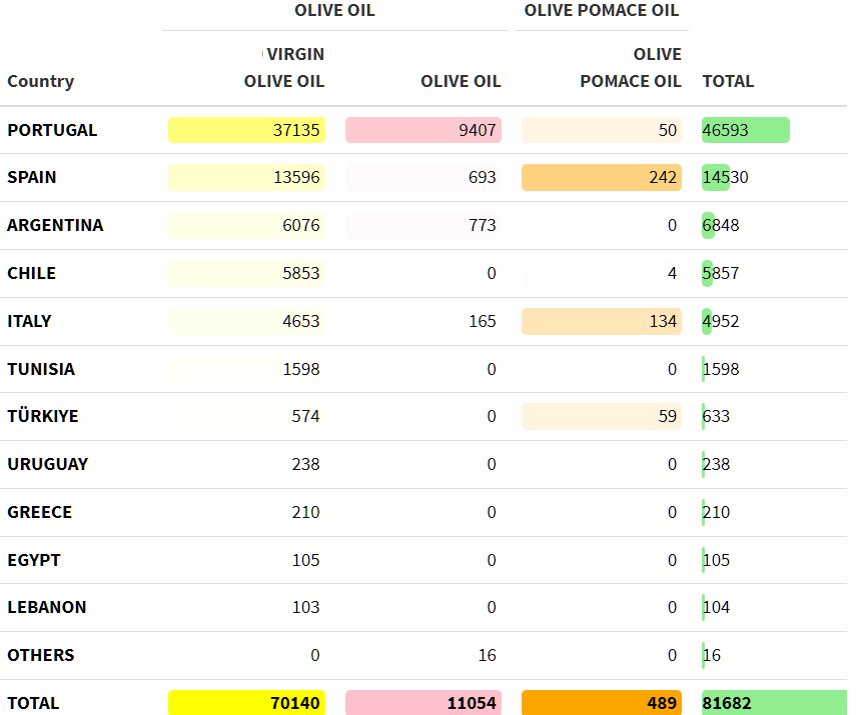
Table 2 – Distribution of imports by product type and partner country (2023/2024) (volume in tonnes)
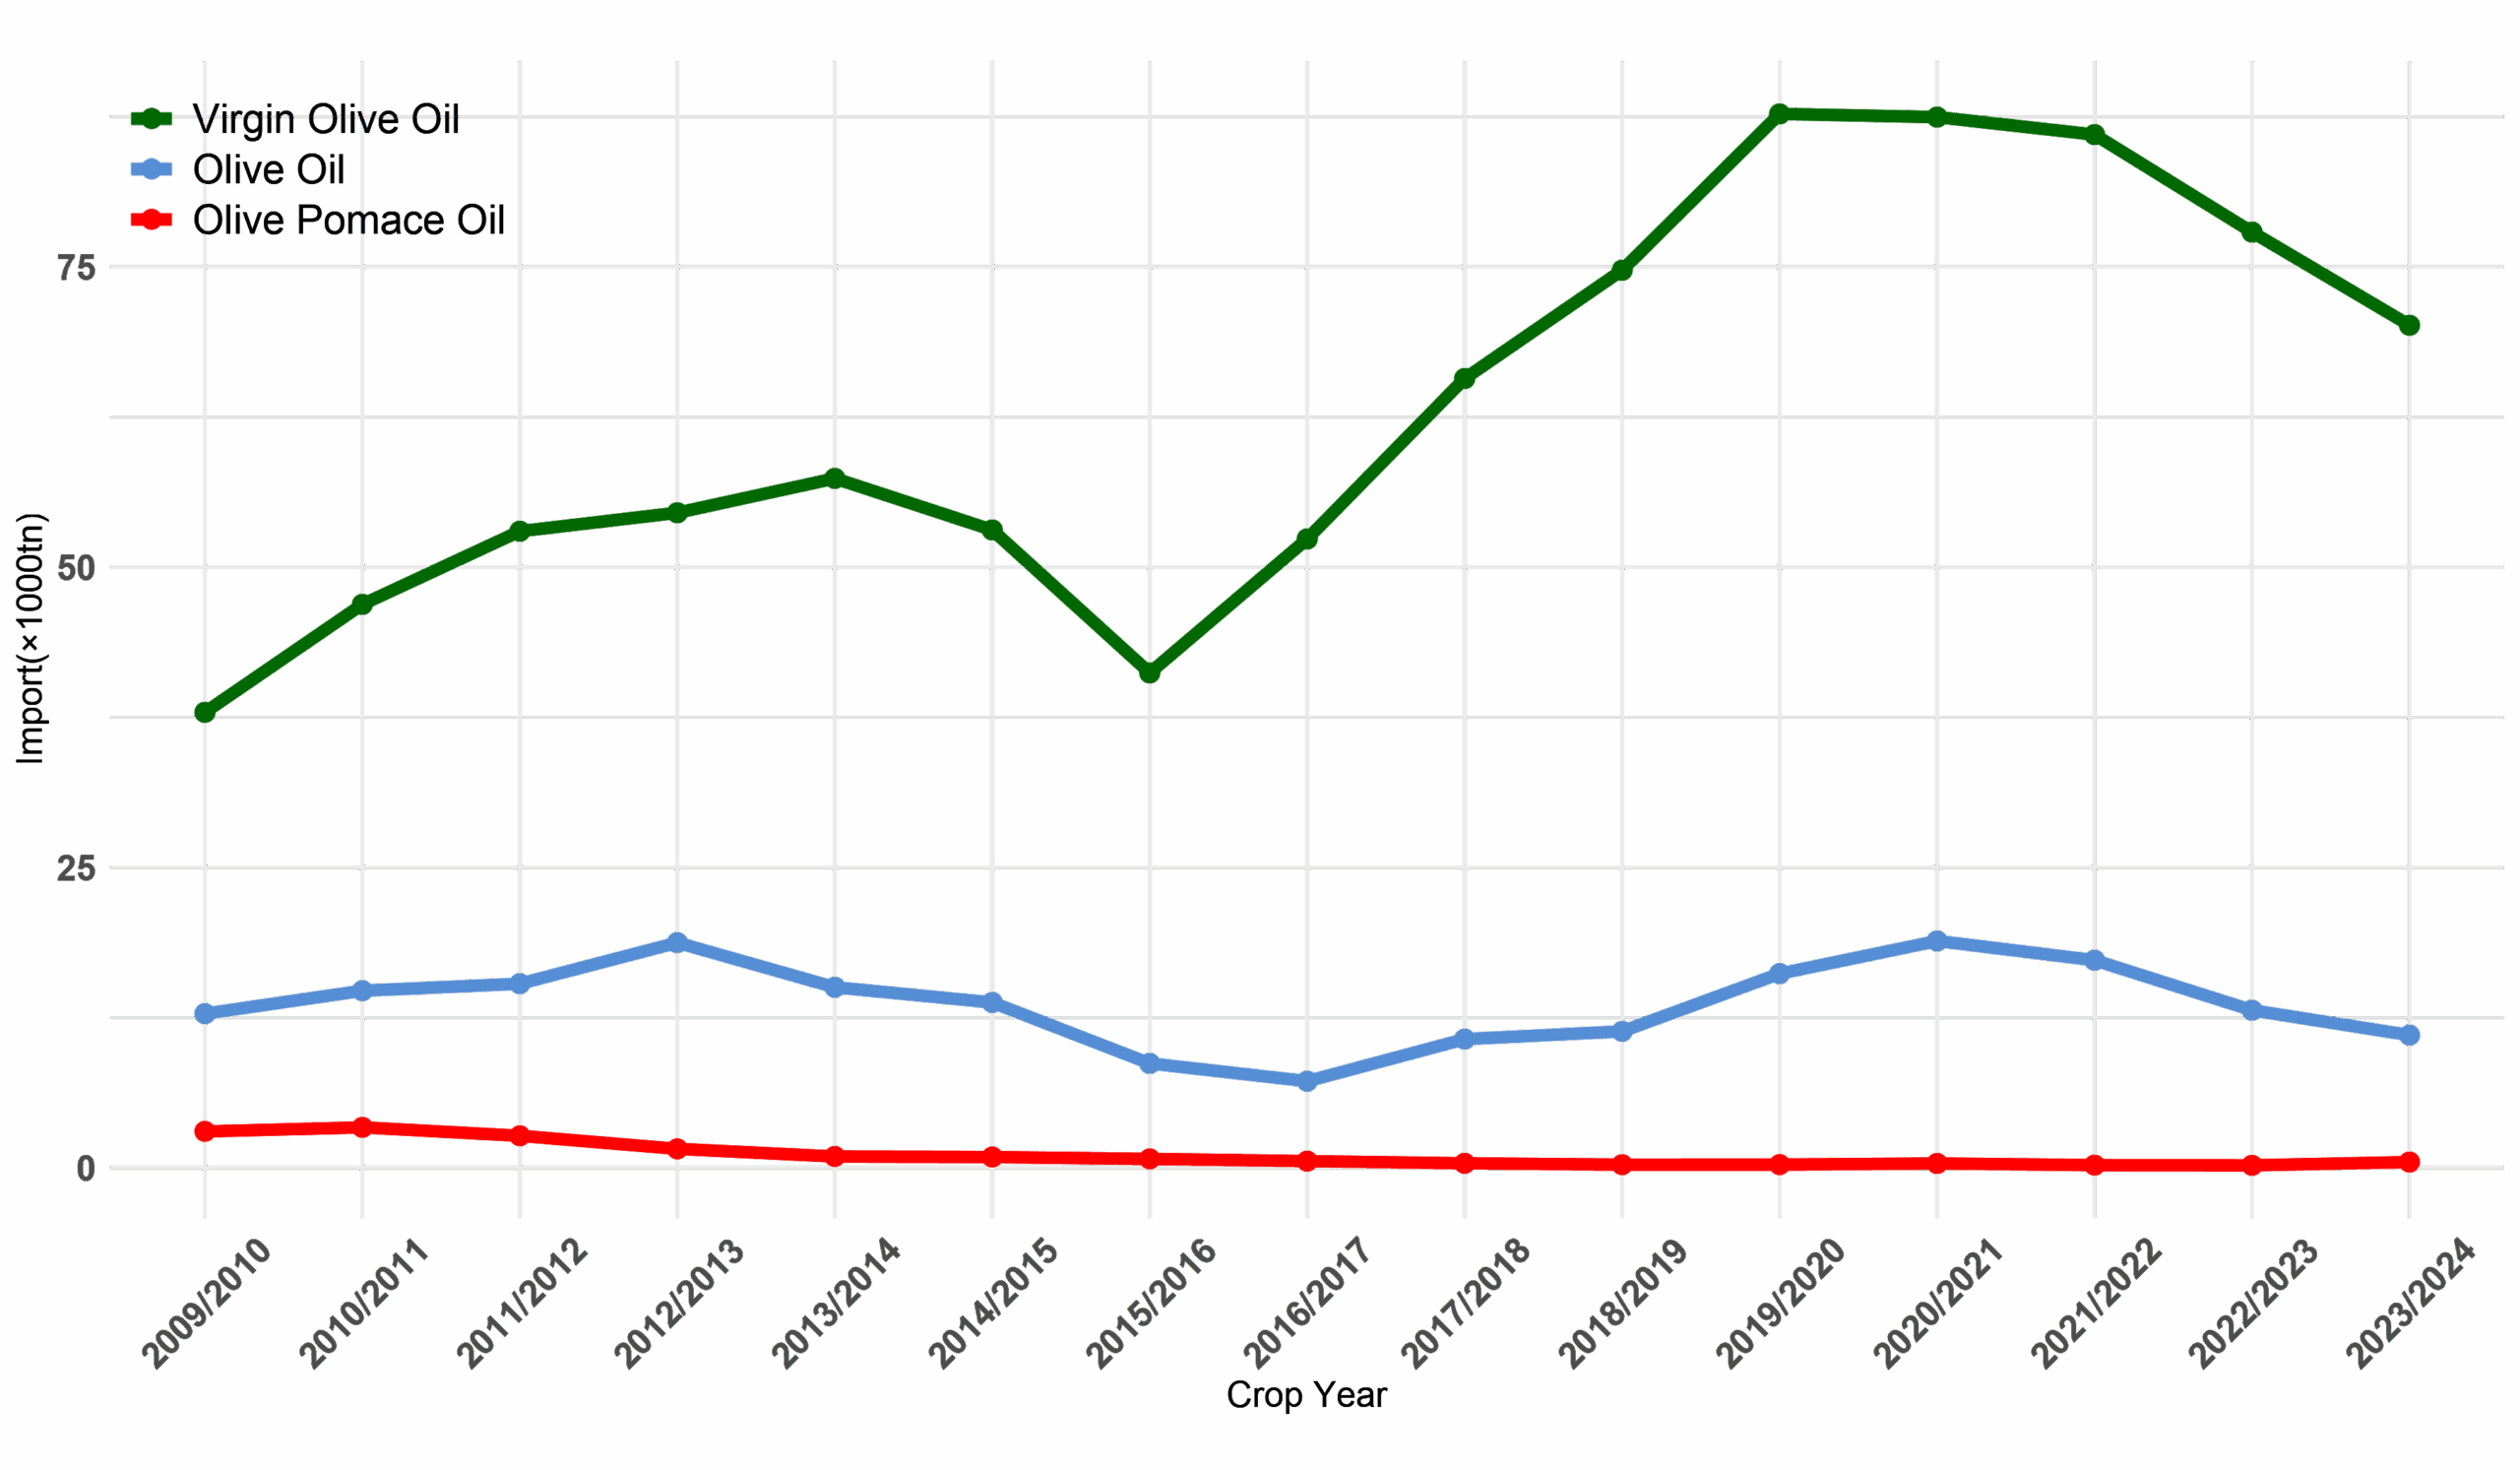
Graph 2 – Evolution of imports by product type – 2009/10 to 2023/24 crop years (×1000 tonnes)
The European Union (EU) exports an average of 79,000 t of olive oil to Brazil per crop year (11% of extra-EU exports), with an estimated value of €403 million. Between October and May of the current crop year, 42,024 t were exported, worth €281 million—84% of which were extra virgin olive oil.
In 2022/23, export volumes fell by 19.4%, though value rose by 12.1%. In 2023/24, export value increased by 44.9% year-on-year. For 2024/25, a recovery in volume is expected, along with a decrease in unit value.

Table 3 – EU extra-EU exports by partner country (volume in tonnes, value in millions of euros)
(2023/2024: provisional data; 2024/2025: data from October 2024 to May 2025)
The estimated unit value of EU exports to Brazil peaked in May 2024 at €1016.8/100 kg. In December 2022, it stood at €554.3/100 kg, and in September 2020 at €319.2/100 kg. According to the latest figures, it dropped to €552.5/100 kg in May 2025.
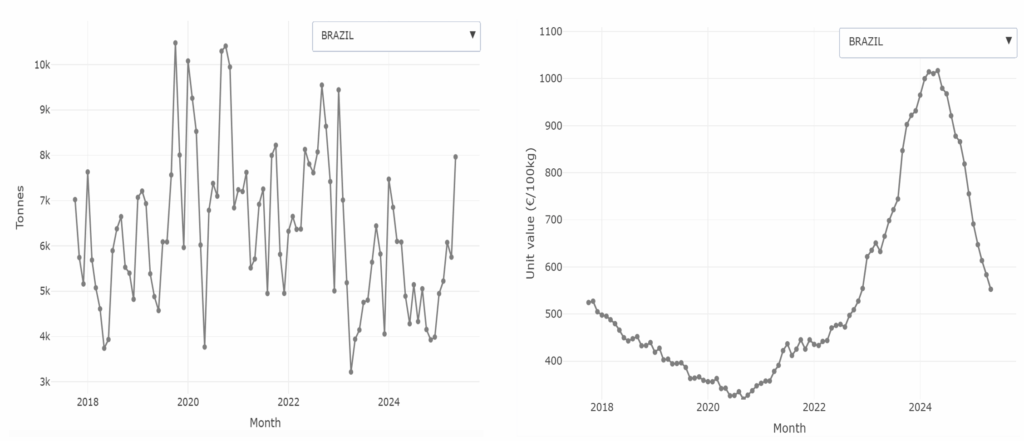
Graph 3 – Monthly evolution of EU exports to Brazil (volume in tonnes, value in €/100 kg)
Prices
In the first week of July 2025, the producer prices of extra virgin olive oil were:
- Jaén (Spain): €358.5/100 kg (-52.6% year-on-year)
- Bari (Italy): €970/100 kg (+2.1%)
- Chania (Greece): €360/100 kg (-53.2%)
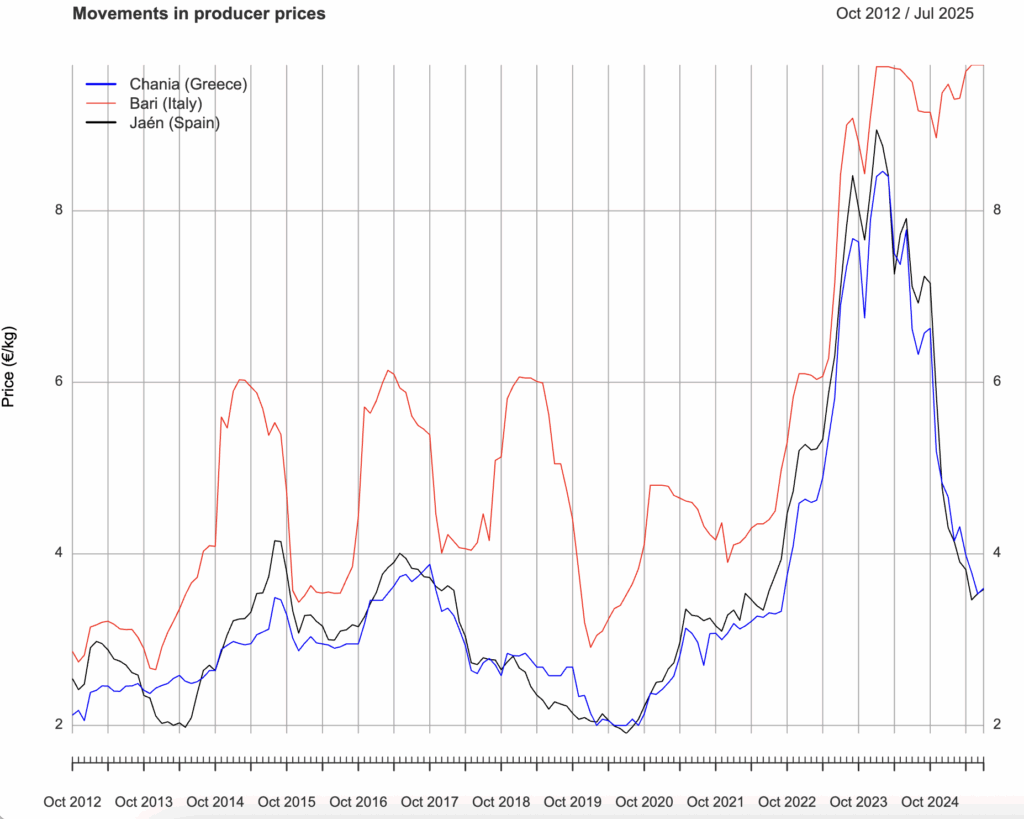
Graph 4 – Monthly evolution of producer prices for extra virgin olive oil (€/kg)
Exports and Imports
Olive Oil Exports
In May 2025, the average unit value of EU extra-EU olive oil exports stood at €554/100 kg (‑42.4% year-on-year or ‑4.1% month-on-month), and at €595/100 kg for extra virgin olive oil.
Export volumes reached 74,914 t (+36.1% year-on-year or +7.5% month-on-month), of which 74.6% were extra virgin olive oil (55,862 t).
The export unit value index reversed trend in March 2024, falling by 4.9% in May compared to April.
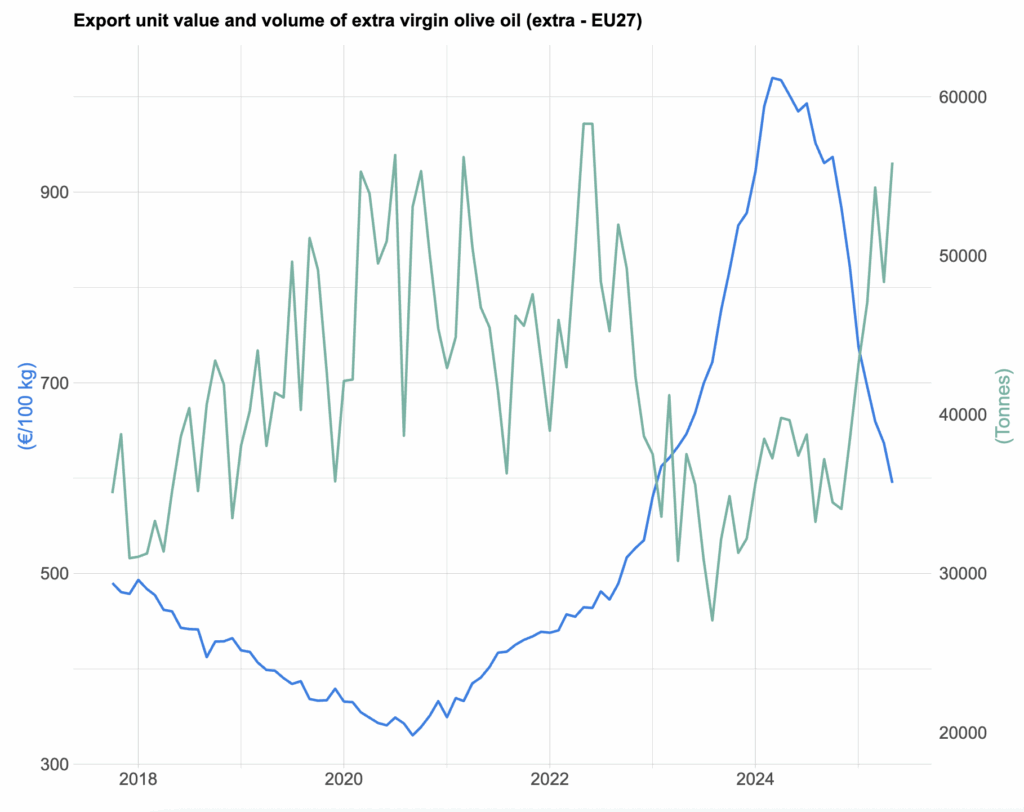
Graph 5 – Monthly evolution of unit value (FOB) and volume of EU extra-EU exports of extra virgin olive oil (volume in tonnes, value in €/100 kg)
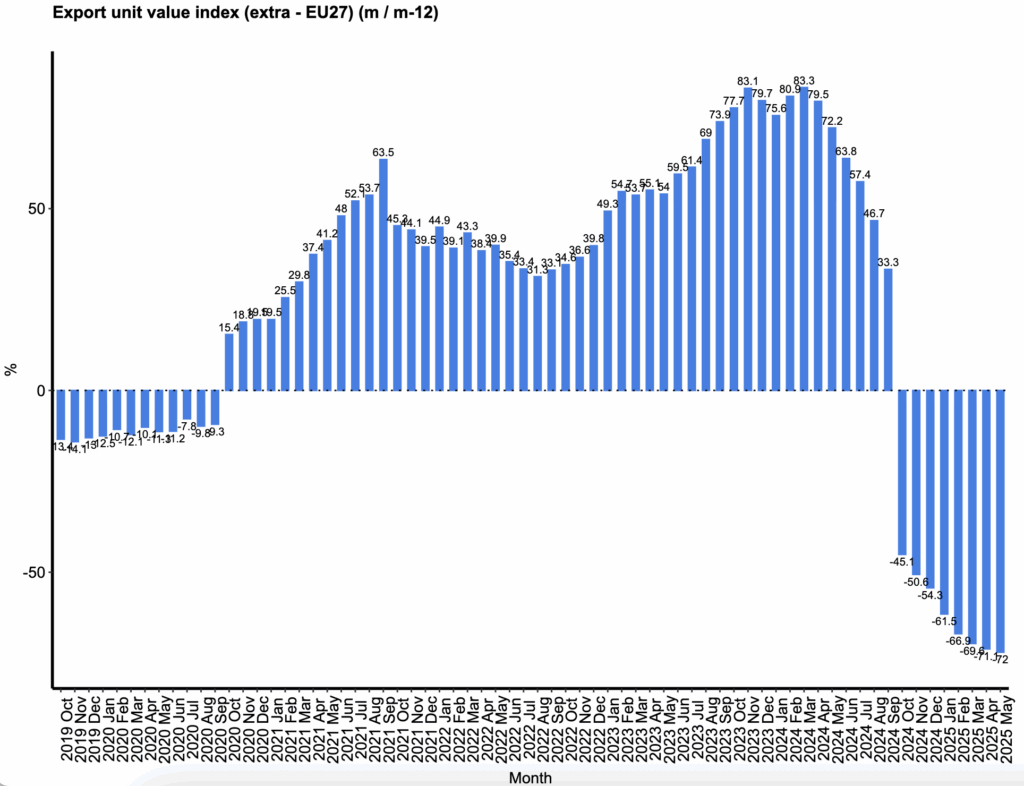
Graph 6 – Monthly evolution of the unit value index of EU extra-EU olive oil exports (% change m/m-12)
Olive Oil Imports
Between October 2024 and May 2025, olive oil imports from major importing markets increased by 6.4% compared to the same period of the previous crop year. Imports from Australia, Canada, China, and the United States showed signs of recovery. In May 2025, imports from Brazil rose by 4.6% year-on-year.
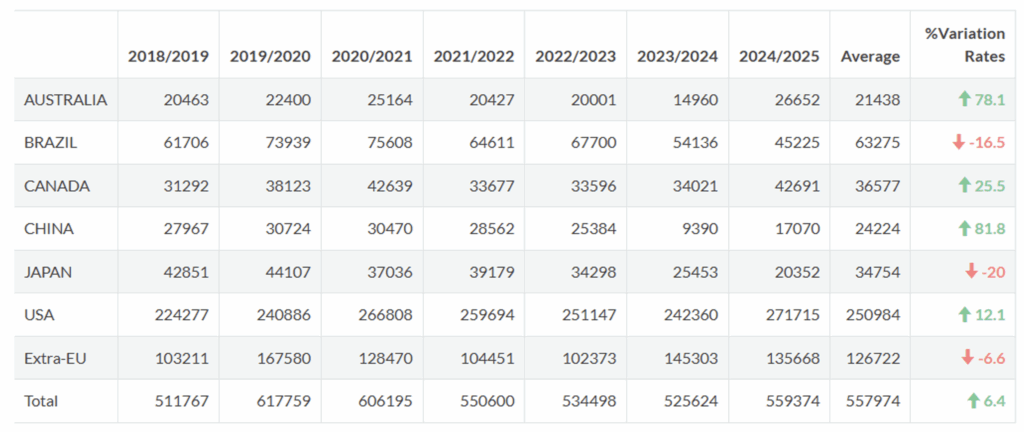
Table 4 – Olive oil imports from selected major markets (October 2024 to May 2025; volume in tonnes)
Harmonised Index of Consumer Prices (HICP)
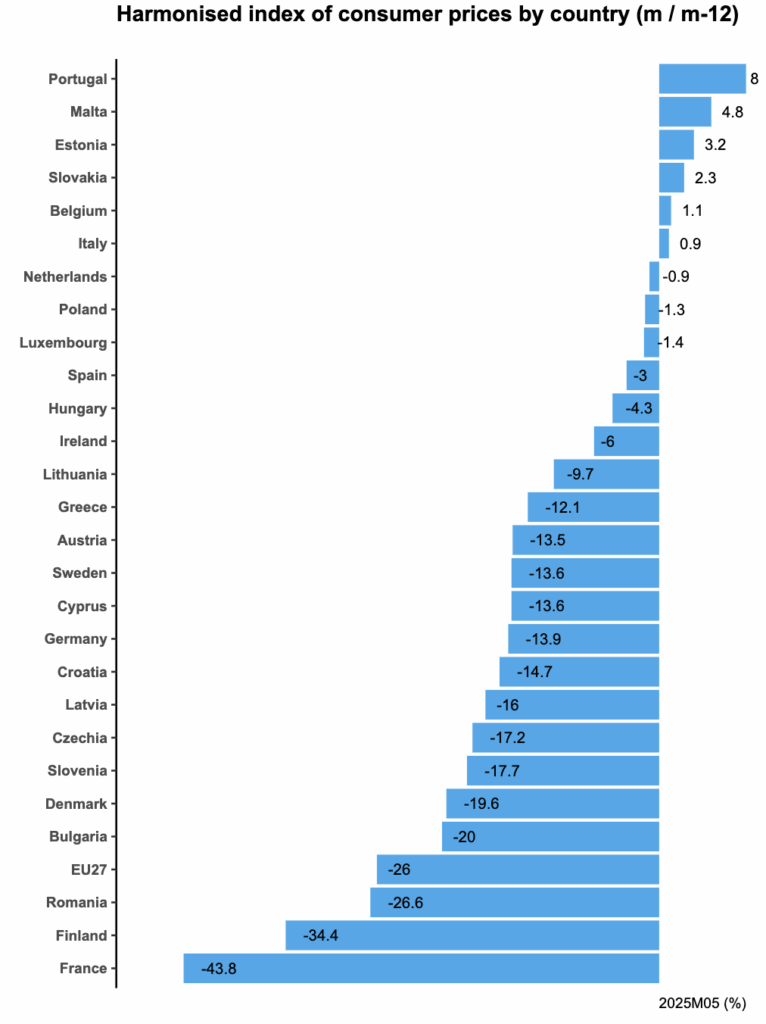
In May 2025, the Harmonised Index of Consumer Prices (HICP) for olive oil in the EU-27 fell by 26% year-on-year, further deepening the downward trend that began in April 2024. The most pronounced declines were recorded in France, Finland, and Romania.
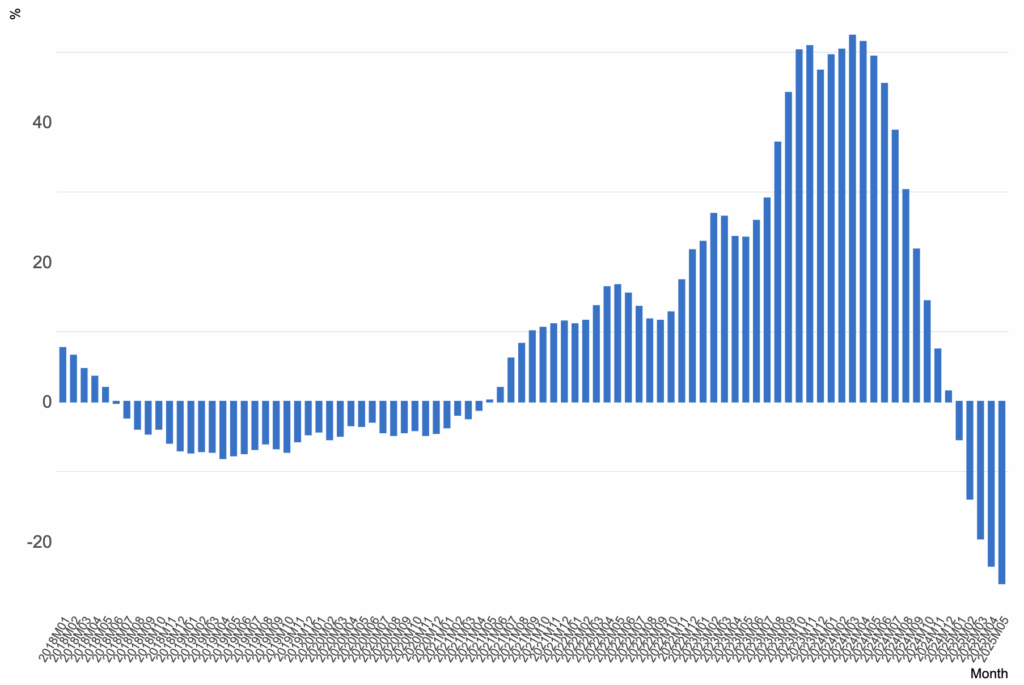
Graph 7 – Evolution of the HICP for olive oil in the EU-27 (% change m/m-12)
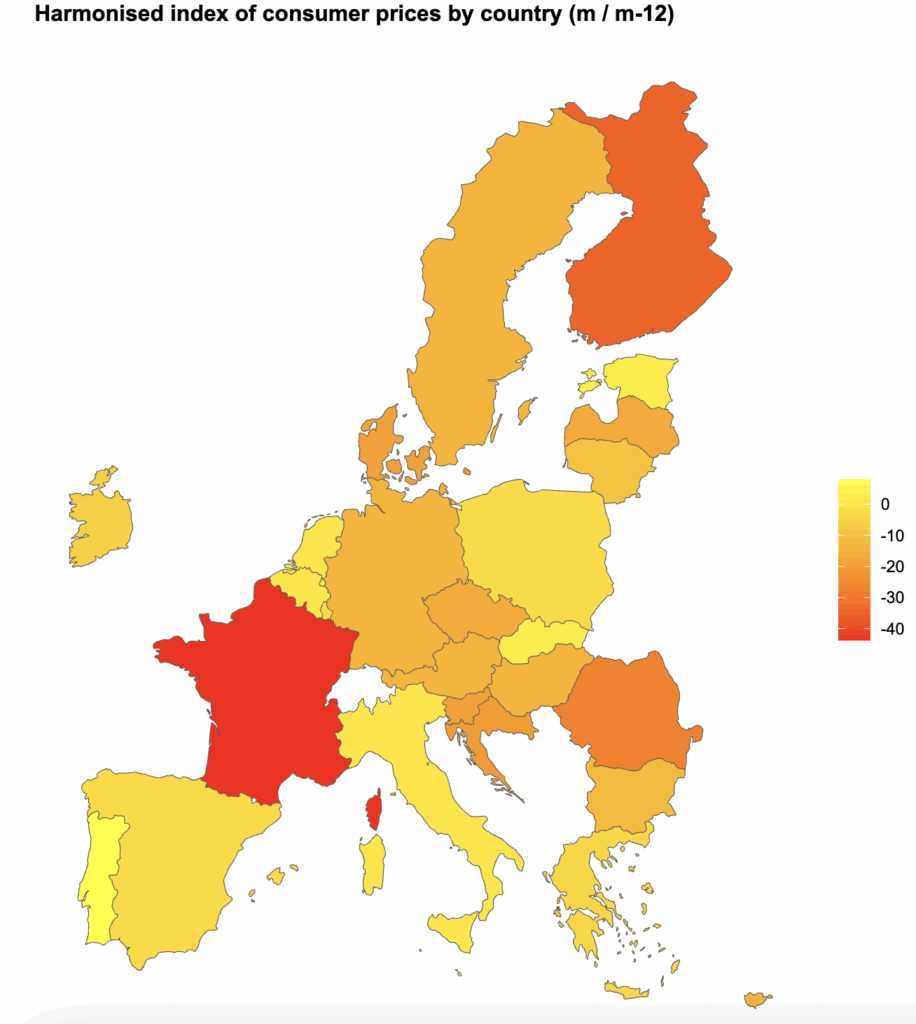
Graph 8 – HICP for olive oil in the EU-27 by country (% change m/m-12)
Graph 9 – HICP for olive oil in the EU-27 by country (% change m/m-12)
Note: Some of the data presented are provisional and may be subject to revision. Figures may be updated or corrected without prior notice.