


Welcome to the IOC, the only intergovernmental organisation in the world that brings together all stakeholders involved in the production and consumption of olive oil and table olives.
Here you will find a summary of the latest sector statistics, including an update on olive oil prices, international trade trends for olive oil and table olives, and olive oil production prices.
Follow us and visit our website to stay up to date with the latest data. If you have any questions, feel free to contact us at: iooc@internationaloliveoil.org.
MARKET SITUATION
UNITED STATES
Olive oil imports from the United States rose by 34% in February compared to the previous month. During the first five months of the 2024/25 crop year (October 2024 – February 2025), cumulative growth stood at 7%.
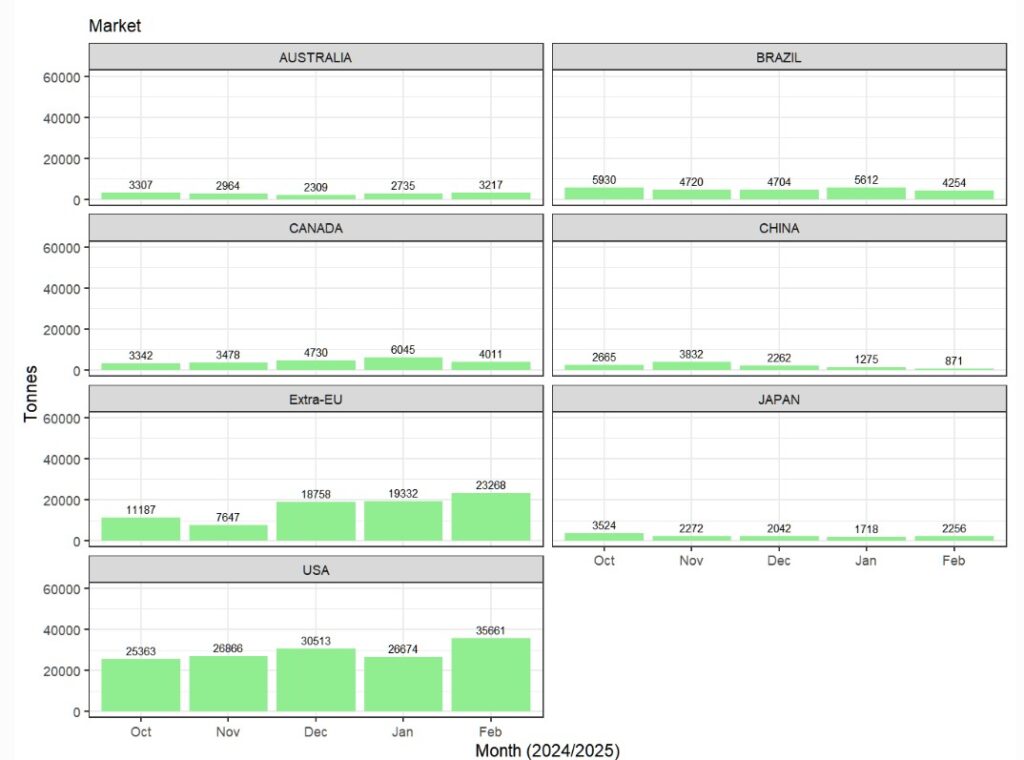
Chart 1: Monthly trend of olive oil imports from selected major markets (2024/25) (tonnes).
The European Union is the United States’ main supplier of olive oil, exporting on average just over 252,000 tonnes per crop year, with an estimated value of around EUR 1,228 million. In the first five months of the current crop year, an estimated 99,033 tonnes were exported to the US, valued at EUR 768.6 million.
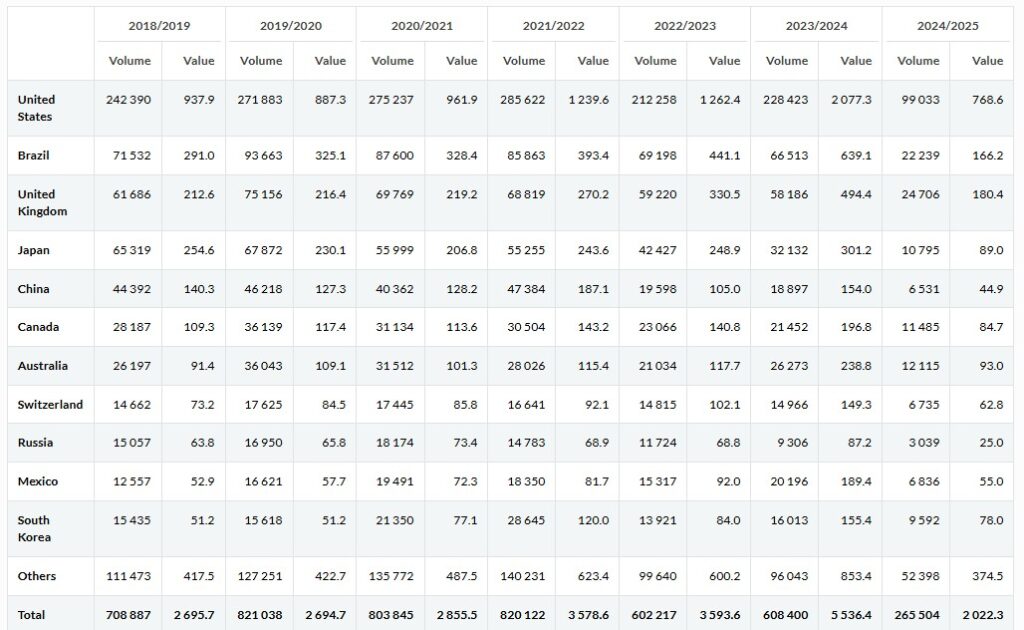
Table 1: Trend in EU extra-EU exports by partner country (volume in tonnes, value in EUR million) (2023/24: provisional data; 2024/25: October 2024 – February 2025)
In the 2022/23 crop year, exports saw a sharp decline of 25.7%. However, the total export value remained at a similar level to the previous year. According to provisional data for 2023/24, the export value increased by 64.6% compared to the previous year. In the 2024/25 crop year, there has been a recovery in the volume exported, coupled with a notable drop in the unit value of exports.
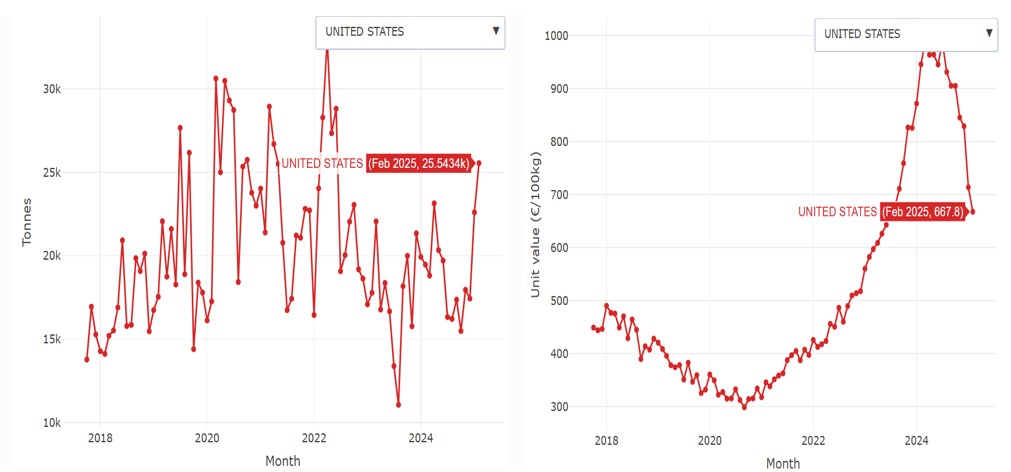
Chart 2: Monthly trend of EU exports to the United States (volume in tonnes, value in EUR/100 kg)
The estimated unit value of EU exports to the US peaked in July 2024 at EUR 987.8/100 kg. For comparison, it stood at EUR 517.9/100 kg in December 2022, and just EUR 298.8/100 kg in September 2020. The latest data indicate a value of EUR 667.8/100 kg in February 2025.
PRICES
As regards producer prices for extra virgin olive oil, figures for the first week of May are as follows:
- Jaén (Spain): EUR 355/100 kg (–53% compared to the same week of the previous crop year)
- Bari (Italy): EUR 970/100 kg (+0.5%)
- Chania (Greece): EUR 390/100 kg (–46%)
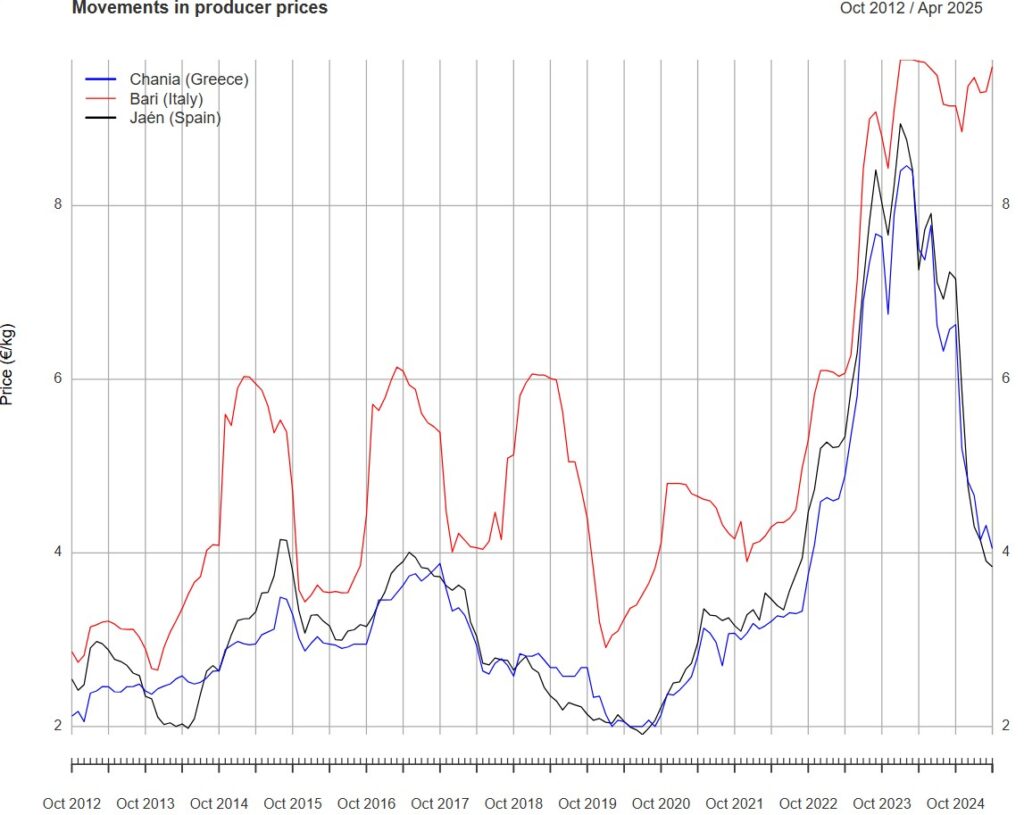
Chart 3: Monthly trend of producer prices for extra virgin olive oil (EUR/kg)
EXPORTS AND IMPORTS
In February of the 2024/25 crop year, the unit value of extra-EU olive oil exports from the European Union was EUR 647/100 kg, marking a –31.9% decline compared to the same month of the previous crop year, and a –7.5% drop from the previous month.
For extra virgin olive oil, the unit value was EUR 696/100 kg.
The total export volume stood at 65,044.9 tonnes (+20.8% year-on-year / +12.2% month-on-month), of which 47,046 tonnes were extra virgin olive oil (72.3% of total exports).
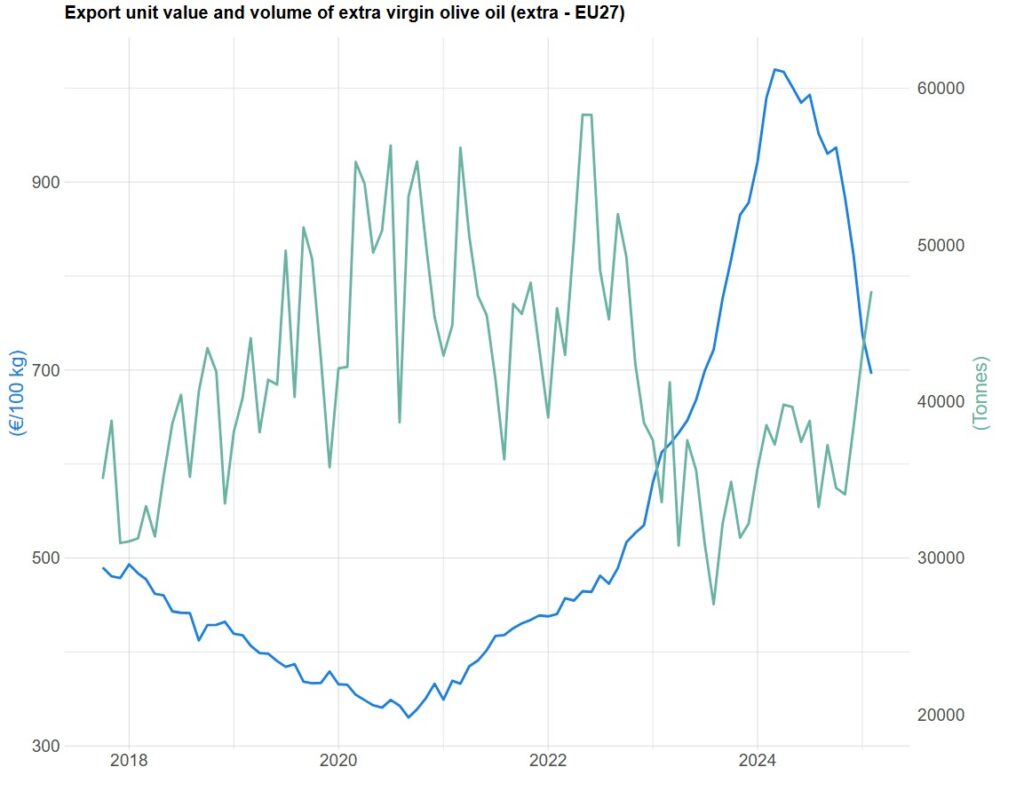
Chart 4: Monthly trend of unit value (FOB) and volume of EU extra-EU exports of extra virgin olive oil (tonnes, EUR)
The unit value index of exports recorded its eleventh consecutive drop compared to the same month of the previous year. In December, the variation compared to January was –7.2%.
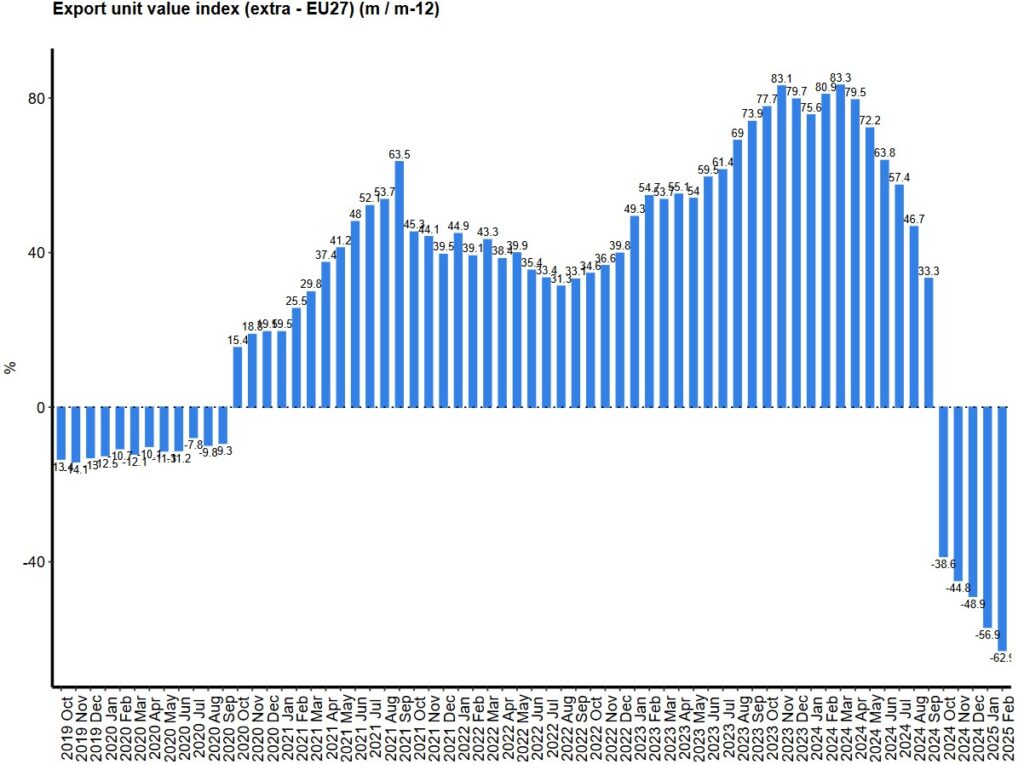
Chart 5: Monthly trend of the unit value index of EU extra-EU olive oil exports. Variation rate (m/m-12) (%)
Meanwhile, olive oil imports from several major markets between October 2024 and February 2025 rose by 4.7% compared to the same period in the previous crop year. A notable recovery in import volumes has been seen from Australia, Canada, China, and the United States.
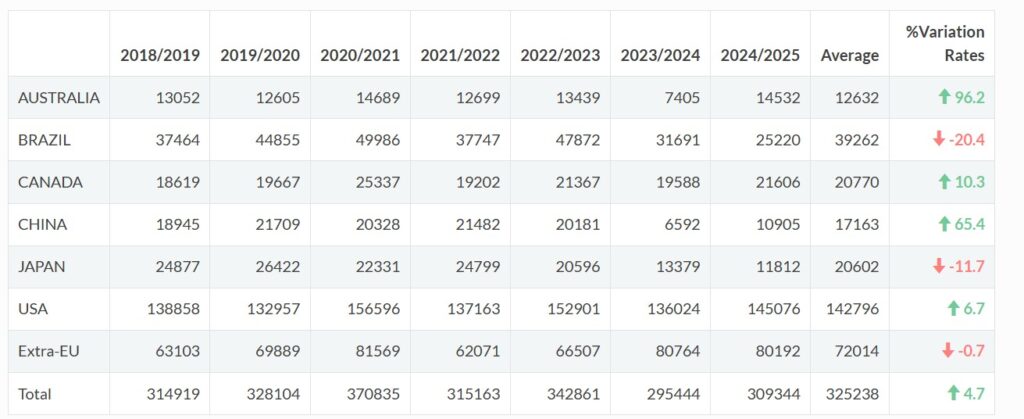
Table 2: Olive oil imports from selected major markets (volume in tonnes) (October 2024 – February 2025)
HARMONISED INDEX OF CONSUMER PRICES (EU-27)
The Harmonised Index of Consumer Prices (HICP) for olive oil in the EU fell by 13.9% in February compared to the same month of the previous year – a sharper drop than in January (–4.7%). The index has been on a downward trend since April 2024.
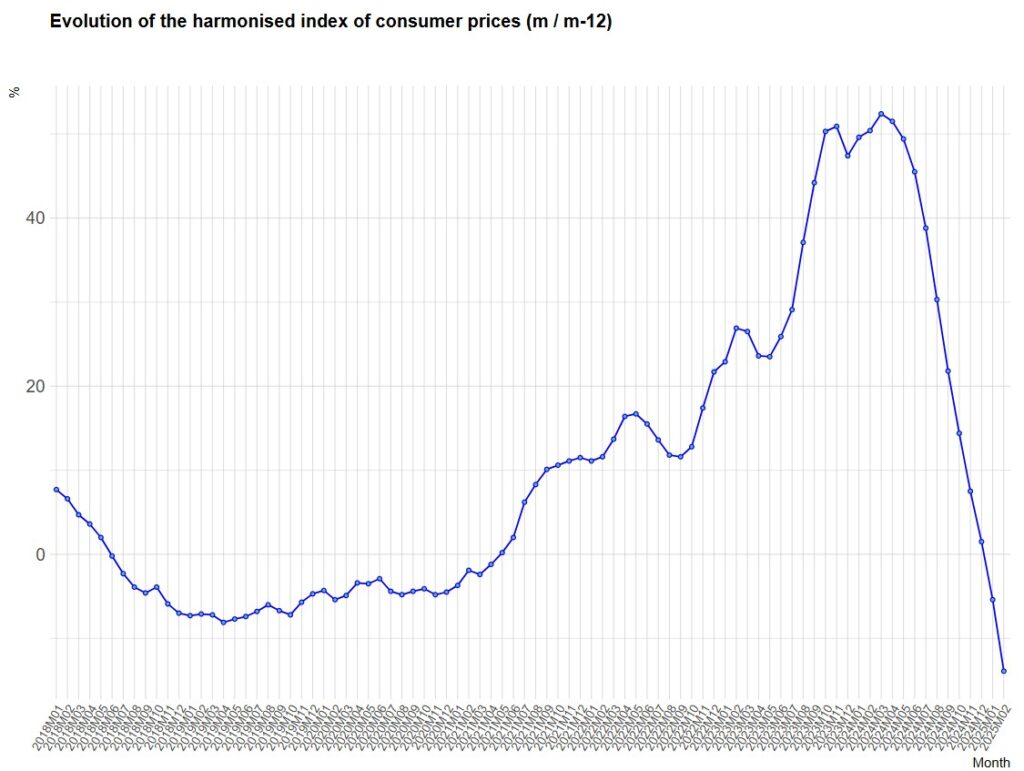
Chart 6: HICP trend for olive oil in the EU-27. Rate of change (m/m-12) (%)
Note: Some figures are subject to revision. Data may be updated or corrected without prior notice.