


Welcome to the International Olive Council (IOC), the only intergovernmental organisation in the world bringing together all stakeholders in the production and consumption of olive oil and table olives.
Here you will find a summary of the latest sector statistics, including an update on olive oil prices, international trade trends for olive oil and table olives, and olive oil producer prices.
Follow us and visit our website to stay up to date with the latest data. Please do not hesitate to contact us if you have any questions (iooc@internationaloliveoil.org).
Market situation
Imports
A focus on Australian olive oil imports
Olive oil imports in Australia reached 42,272 tonnes in the 2024/25 crop year, representing an increase of 46% compared to the 2023/24 crop year. In the first three months of the 2025/26 crop year (October 2025 – January 2026), imports increased by 12.5%.
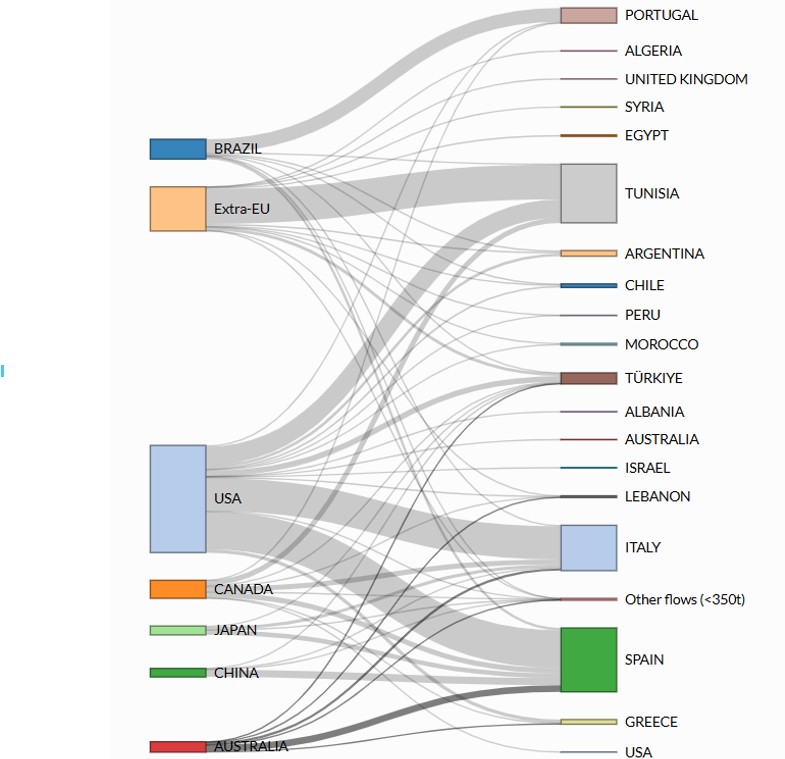
Figure 1. Olive oil import flows from selected major markets and partner countries. 2024/25.
Australian imports recorded strong growth during the last crop year, reaching 42,272 tonnes (+46%). Table 1 shows the evolution of imports over the last six crop years for olive oil and olive pomace oil.
Spain, Italy, Türkiye, Greece and Lebanon remain the main suppliers to Australia, jointly accounting for 97.3% of total imports. In the 2024/25 crop year, compared with the previous crop year, imports increased significantly from Türkiye (+187.8%), Greece (+162.4%) and Lebanon (+158.7%), alongside more moderate increases from Spain (+40.4%) and Italy (+25.1%).
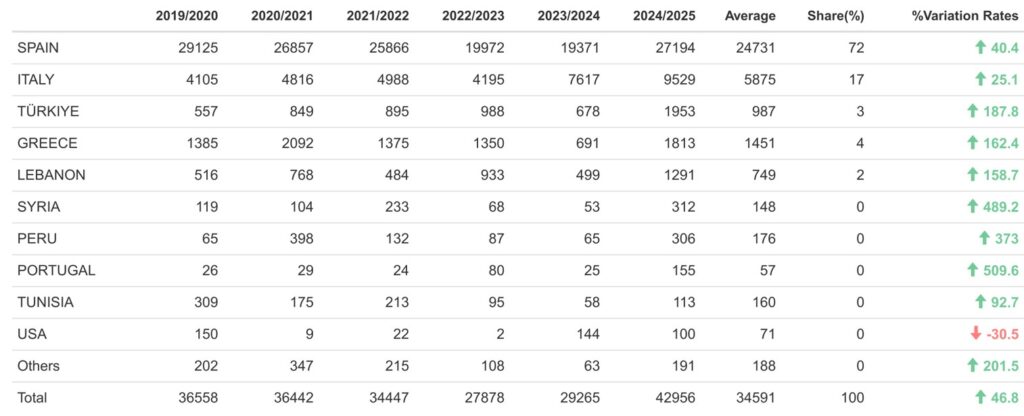
Table 1. Imports of olive oil and olive pomace oil into Australia by partner country (2019/20 – 2024/25) (t).
In terms of product categories, 72.9% of imports correspond to virgin olive oils, followed by 25.5% corresponding to olive oils (classified under CN code 15.09.90), while the remaining 1.6% corresponds to olive pomace oils.
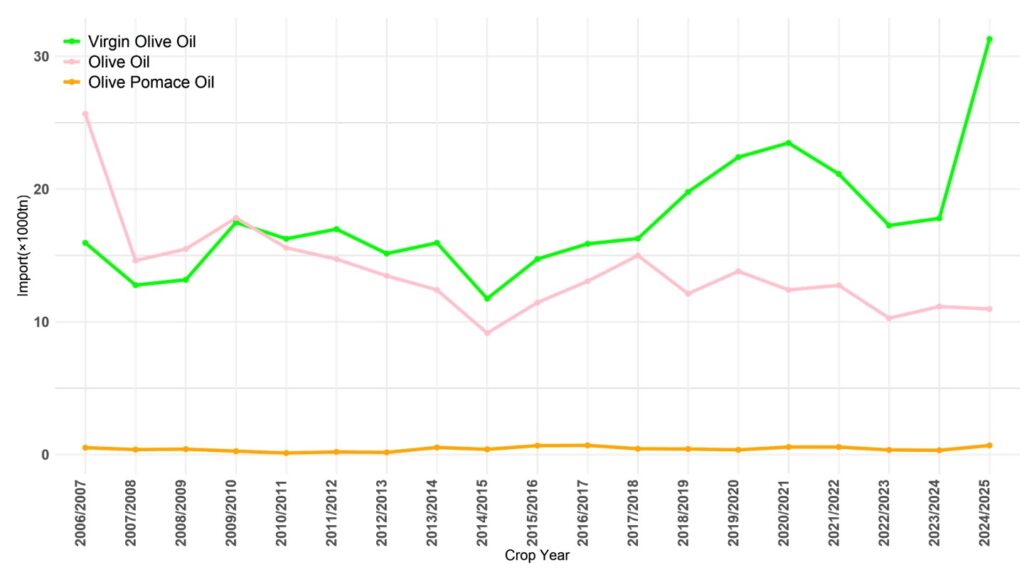
Figure 2. Evolution of Australian imports by product category (2005/06 – 2024/25) (×1,000 t).
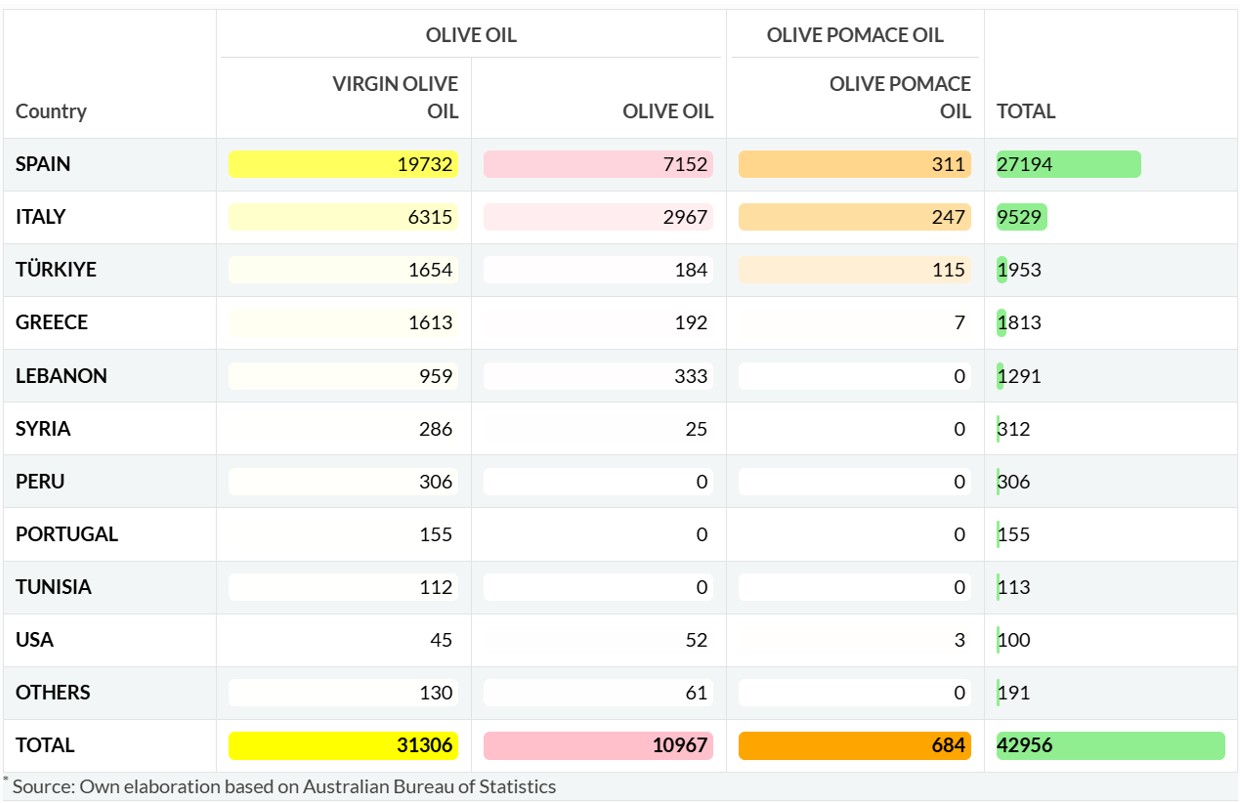
Table 2. Distribution of Australian imports by product category and partner country (2024/25) (t).
World olive oil imports
Imports of olive oil from selected major markets during the 2025/26 crop year (October 2025 – January 2026) increased by 9.2% compared to the same period of the previous crop year. An upward trend is observed in most markets, with the exception of Canada and the United States.
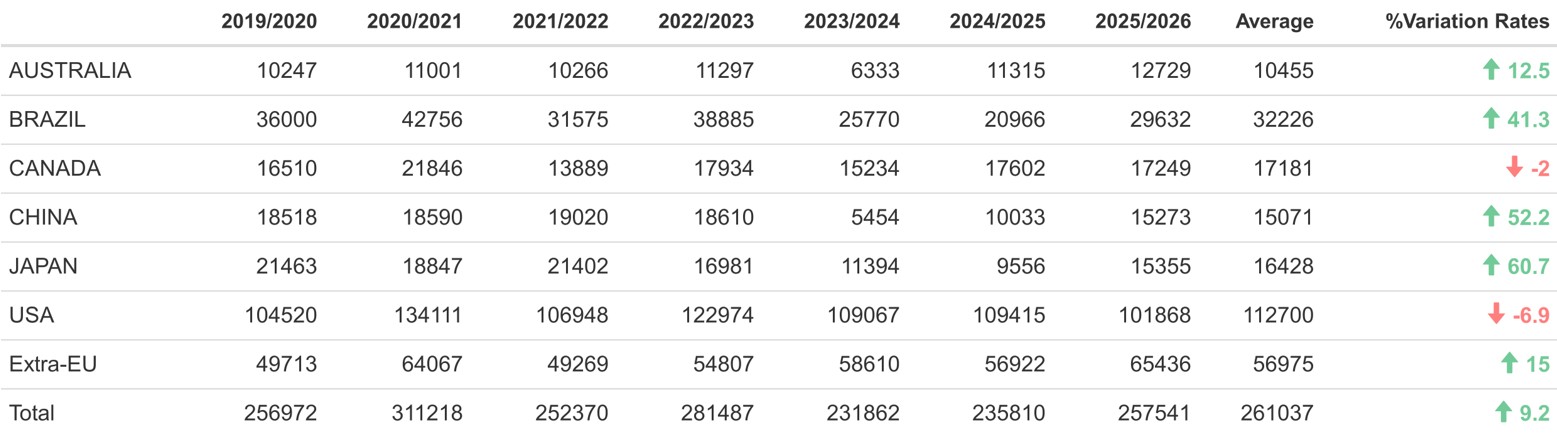
Table 3. Imports of olive oil from selected major markets (October 2025 – January 2026) (t).
World table olive imports
Imports of table olives from selected major markets, covering the period from September 2025 to January 2026, increased by 7.8% compared to the same period of the 2024/25 crop year.
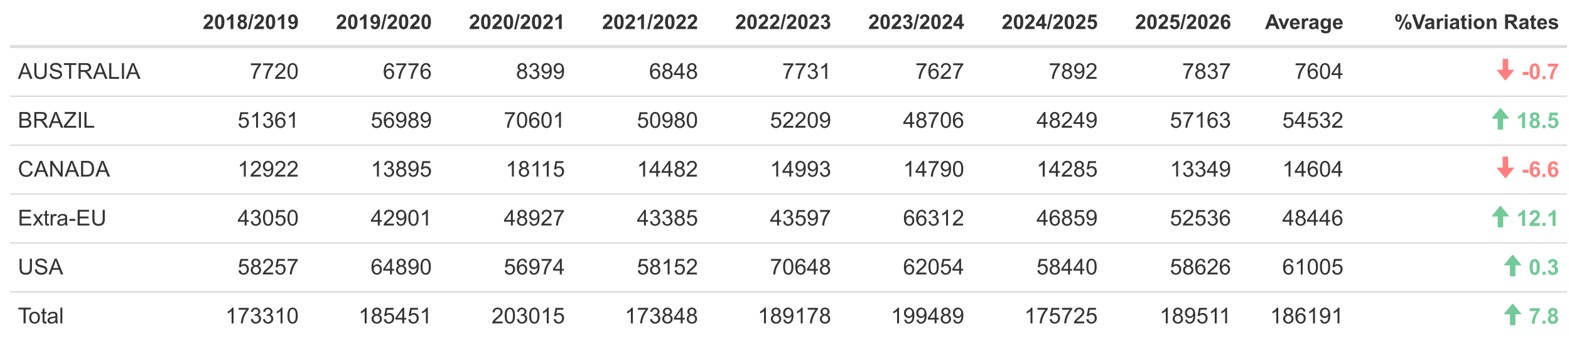
Table 4. Imports of table olives from selected major markets (September 2025 – January 2026) (t).
Prices
With regard to extra virgin olive oil producer prices:
- Jaén (Spain): in the week of 16–22 March, €438.5/100 kg, representing an increase of 14.8% compared to the same week of the previous crop year.
- Bari (Italy): in the same week, €650/100 kg (-30.1%).
- Chania (Greece): €430/100 kg (+1.2%).
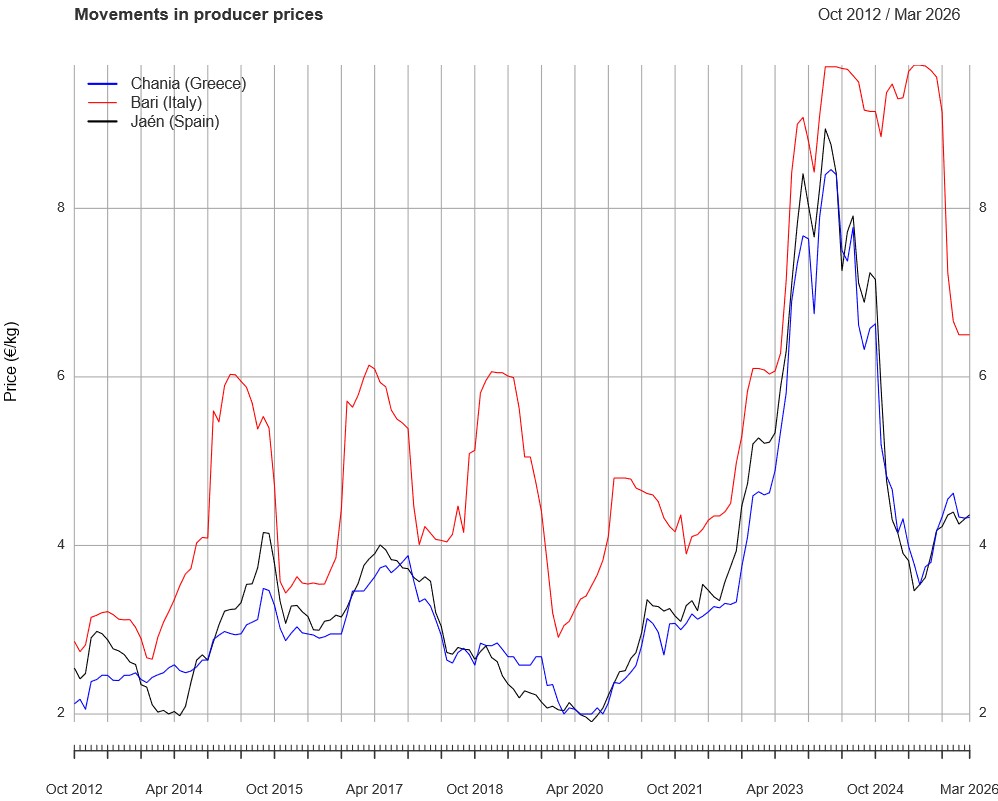
Figure 3. Evolution of monthly extra virgin olive oil producer prices.
Some data are subject to revision. Figures may be updated or corrected without prior notice.