EU27 – Harmonised Index of Consumer Prices – Olive oil
International Olive Council
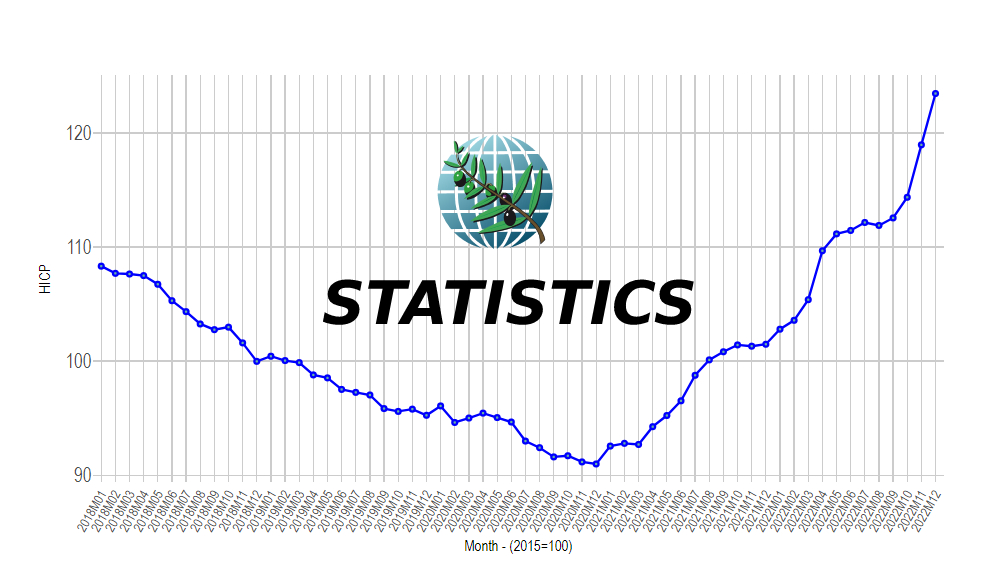
In March 2023, the annual variation rate of the Harmonised Index of Consumer Prices (HICP) for olive oil in the EU-27 stood at +26.4%.
- The HICP in the EU-27 for the month of March stood at 133.2 (2015 = 100).
- The variation rate of the HICP stood at +26.4% compared to the same period in the previous crop year or +1.4% compared to the previous month.
By country, the largest increases took place in Romania, Ireland, Estonia and France, while Slovakia, Greece, Italy and Portugal reached the smallest increases. Six countries remain above the EU-27 value.
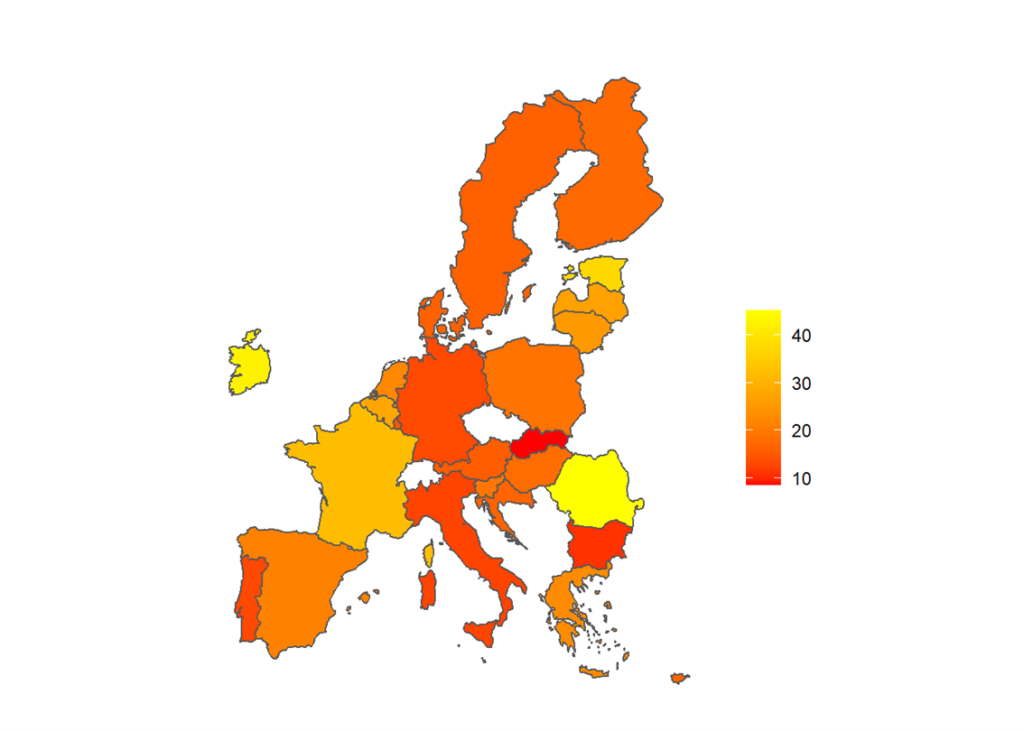
Figure 1: Percentage change by country (m/m-12) (%)
https://www.internationaloliveoil.org/what-we-do/economic-affairs-promotion-unit/#prices
OLIVE OIL AND TABLE OLIVES TRADE FIGURES IN THE EUROPEAN UNION (EU-27)
International Olive Council
In January 2023, the unit value of extra-EU exports stood at € 564 per 100kg (+8.1% compared to the previous month).
As for the first estimates of the 2021/2022 crop year, extra-EU exports of olive oil reached 819 973 tonnes for an estimated value of 3 578 million euros (+2% and +25.3%, respectively, compared to the previous crop year).
In January of the 2022/2023 crop year, the unit value of extra-EU exports stood at €564 per 100kg (+34.6% compared to the same period in the previous crop year or +8.1% compared to the previous month) while the export volume stood at 51 580 tonnes (-5.7% compared to the same period in the previous crop year or -0.7% compared to the previous month).
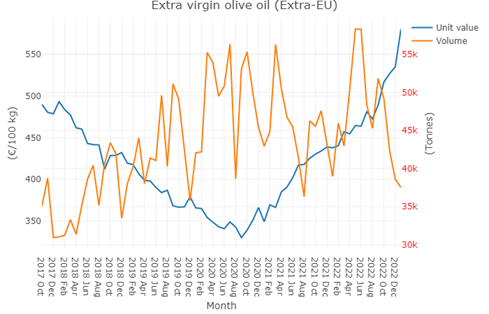
Graph 1: Unit value and volume of exports
On the other hand, also in January, the imports of the EU from Tunisia reached 3 322.3 tonnes (-87.4%, compared to the previous month).
As for table olives, first estimates of the 2021/2022 crop year put extra-EU exports at 322 670 tonnes for an estimated value of 1 002 million euros (+3.5% and +15.3%, respectively, compared to the previous crop year).
In January, extra-EU imports in January mainly came from Morocco (-19.5%), Türkiye (-26.6%), Egypt (+45.1%), and Albania (+31.7%). The data in parentheses indicates the evolution of imports compared to the same period of the previous crop year.
https://www.internationaloliveoil.org/what-we-do/economic-affairs-promotion-unit/#prices
https://www.internationaloliveoil.org/what-we-do/economic-affairs-promotion-unit/#exports
