


Welcome to the IOC, the only intergovernmental organisation in the world that brings together all stakeholders involved in the production and consumption of olive oil and table olives.
Here you will find a summary of the latest sector statistics, including an update on olive oil prices, international trade trends for olive oil and table olives, and olive oil production prices.
Follow us and visit our website to stay up to date with the latest data. Feel free to contact us at iooc@internationaloliveoil.org if you have any questions.
Market situation
Olive oil
Prices
In September, extra virgin olive oil producer prices rose again, exceeding €4/kg. However, by the last week of the month, they remained 41% lower than during the same period of the previous crop year.
In August, the average unit value of extra-EU exports stood at €532/100 kg, representing a 42% decrease compared with the same period of the previous crop year. This situation contributed to an 11% increase in olive oil imports from the main markets between October 2024 and July 2025.
Producer prices for extra virgin olive oil were as follows:
- Jaén (Spain): €431.5/100 kg (−41% vs the same week of the previous year, 22–28 September)
- Bari (Italy): €943/100 kg (+3%)
- Chania (Greece): €440/100 kg (−34%)
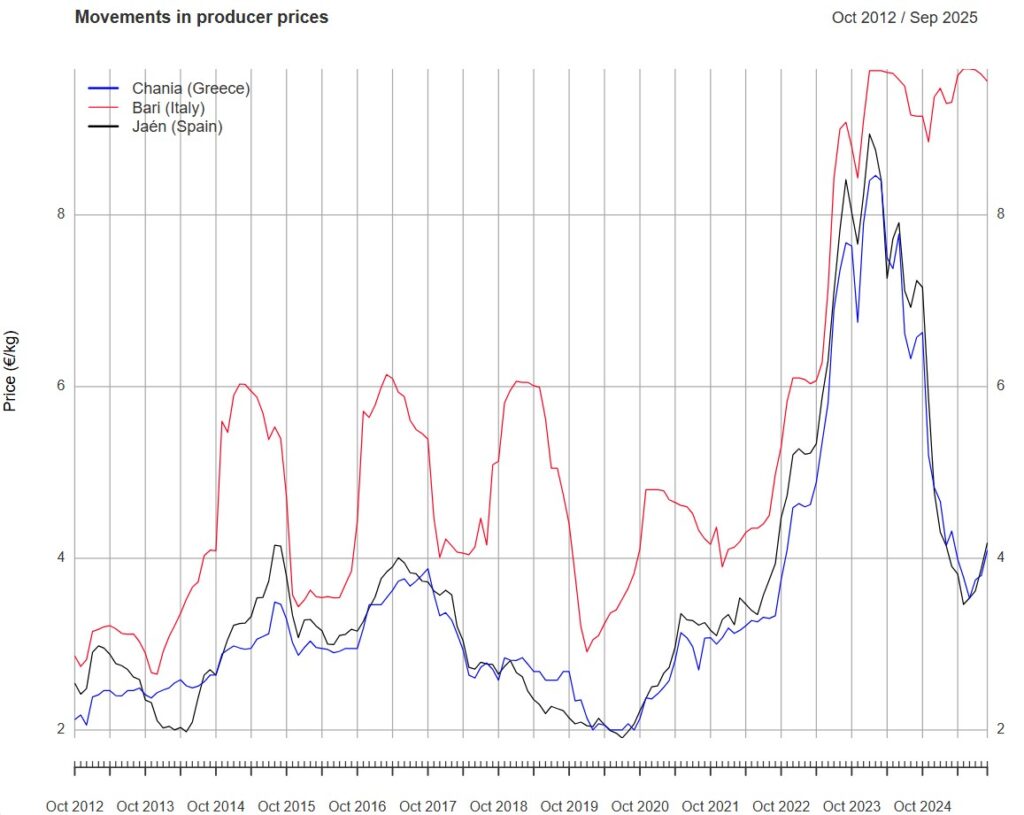
Graph 1. Monthly evolution of extra virgin olive oil producer prices (€ / kg)
Exports
In August 2025, the unit value of extra-EU olive oil exports was €532/100 kg (−41.9% vs the same period of the previous crop year; −1.9% vs the previous month).
For extra virgin olive oil, this figure reached €580/100 kg.
The export volume totalled 51,406 t (+15.0% year-on-year; −31.2% vs previous month), of which 70.8% (36,402 t) corresponded to extra virgin olive oil.
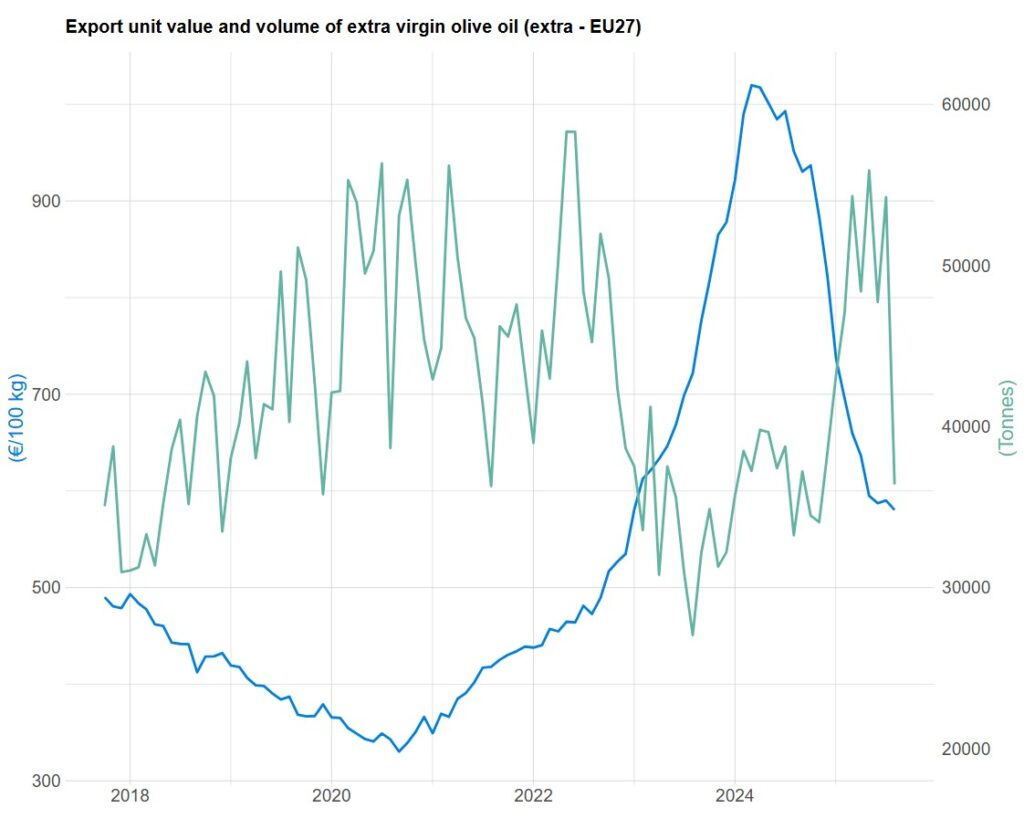
Graph 2. Monthly evolution of the unit value (FOB) and volume of EU extra-EU exports of extra virgin olive oil (volume in tonnes; value in €/100 kg)
The export unit value index changed trend in March 2024. In August 2025, it decreased by 73.2% year-on-year and by 1.6% compared with the previous month.
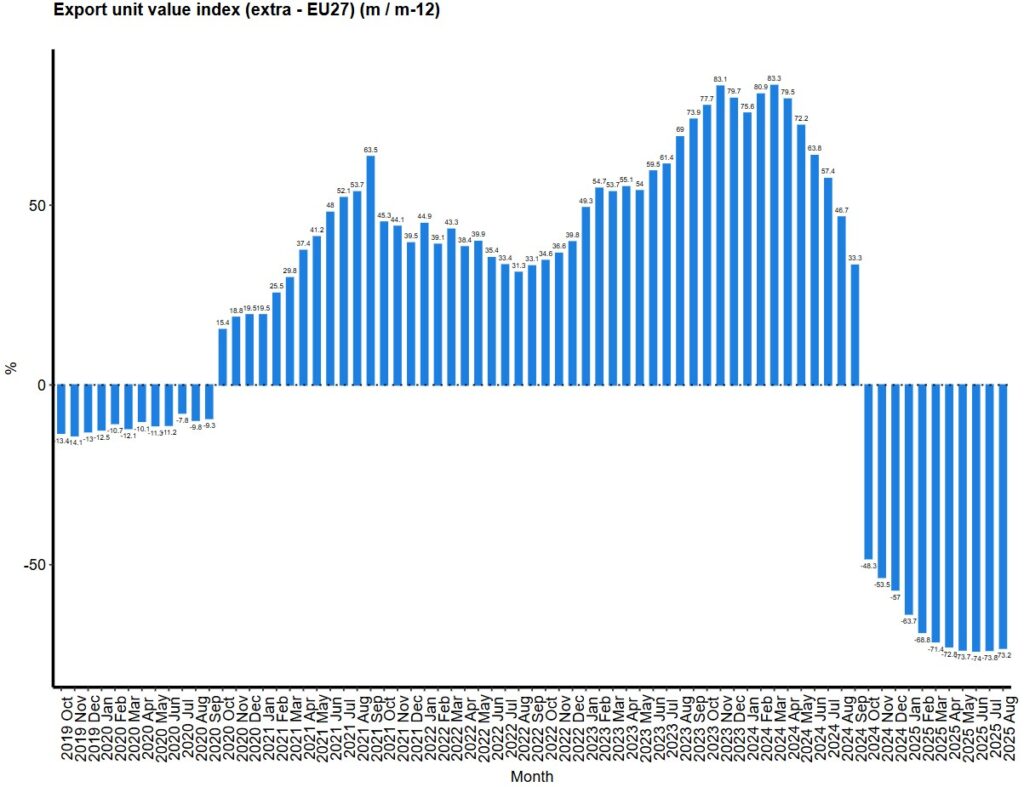
Graph 3. Monthly evolution of the unit value index of EU extra-EU olive oil exports (year-on-year variation, %)
Imports
Between October 2024 and July 2025, olive oil imports from the main markets increased by 11% compared with the same period of the 2023/24 crop year.
A significant recovery was observed in Australia, Canada, China and the United States.
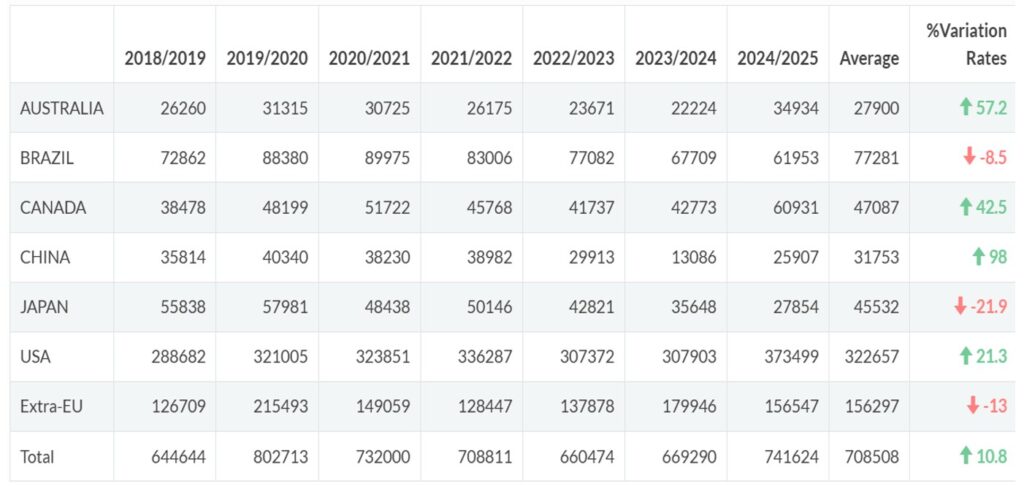
Table 1. Olive oil imports from some of the main markets (October 2024 – July 2025) (volume in tonnes)
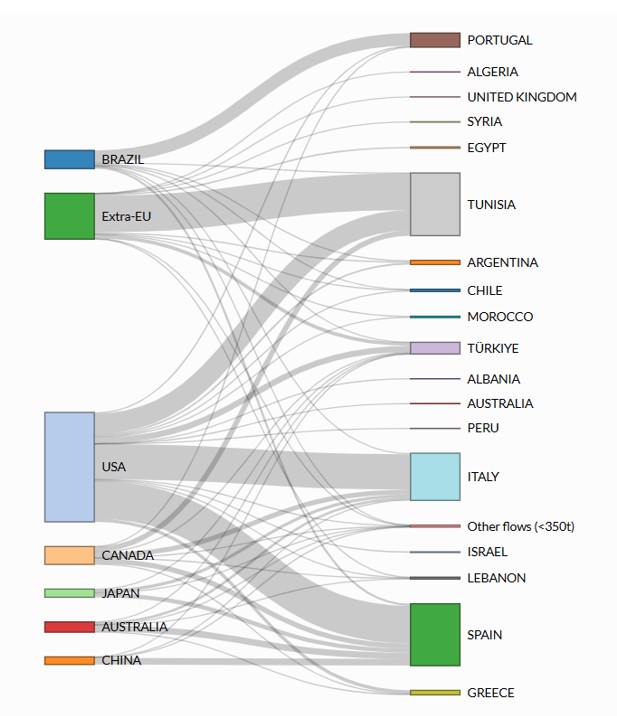
Graph 4. Olive oil import flows between main importing markets and partner countries
Consumption
The Harmonised Index of Consumer Prices (HICP) for olive oil in the EU fell by 27.5% in August 2025 compared with the same month of the previous year, a slightly smaller decline than in July (−1.4% month-on-month).
The index has been on a downward trend since April 2024.
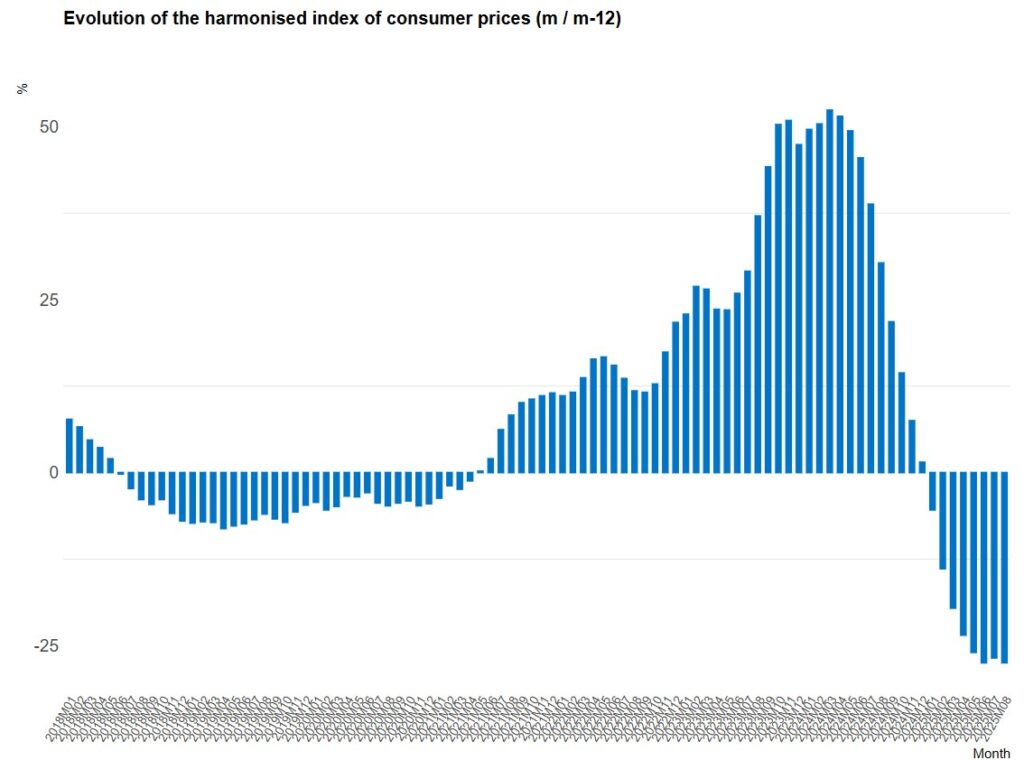
Graph 5. Evolution of the HICP for olive oil in the EU-27 (year-on-year variation, %)
The sharpest decreases were recorded in France, Finland and Bulgaria.
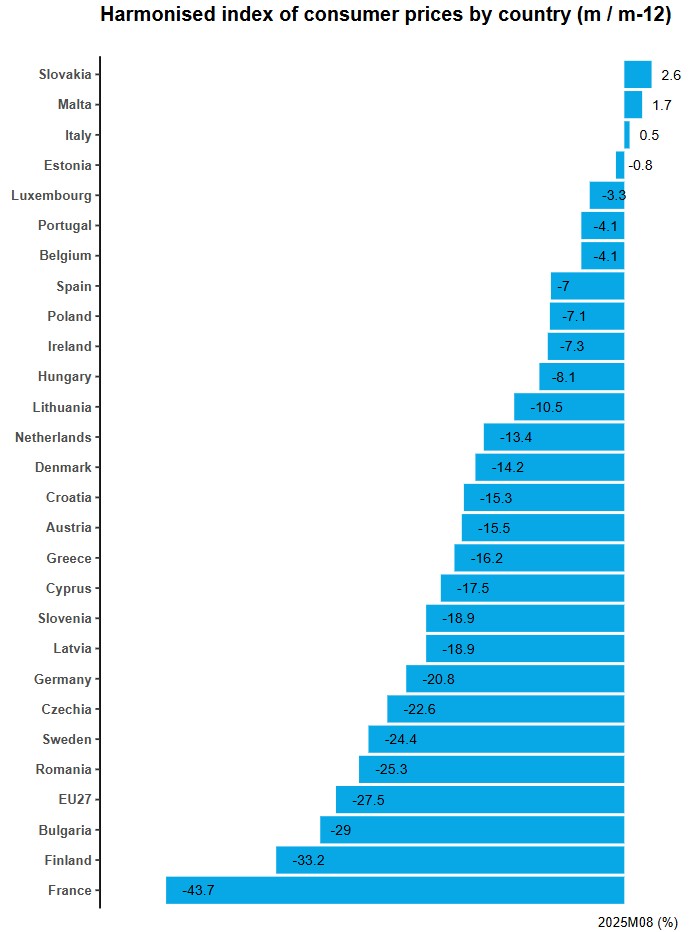
Graph 6. HICP for olive oil by country in the EU-27 (year-on-year variation, %)
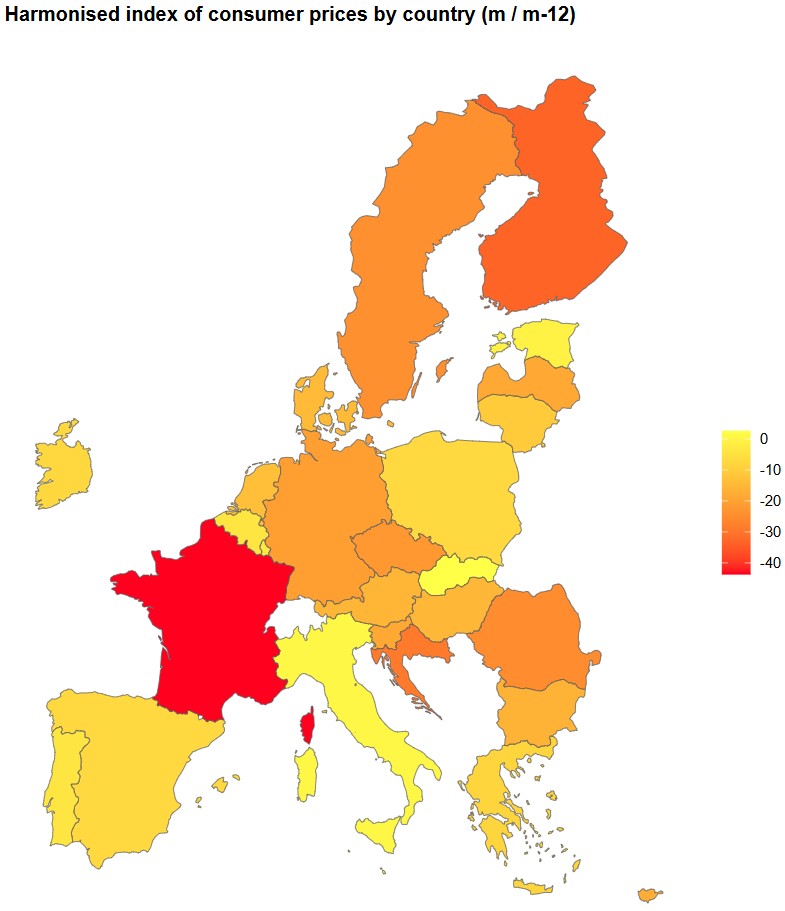
Graph 7. HICP for olive oil by country in the EU-27 (m/m-12 variation, %)
Table olives
Imports
Between September 2024 and July 2025, table olive imports in the main markets decreased by 13% compared with the same period of the 2023/24 crop year.
Imports declined in all markets except Canada.
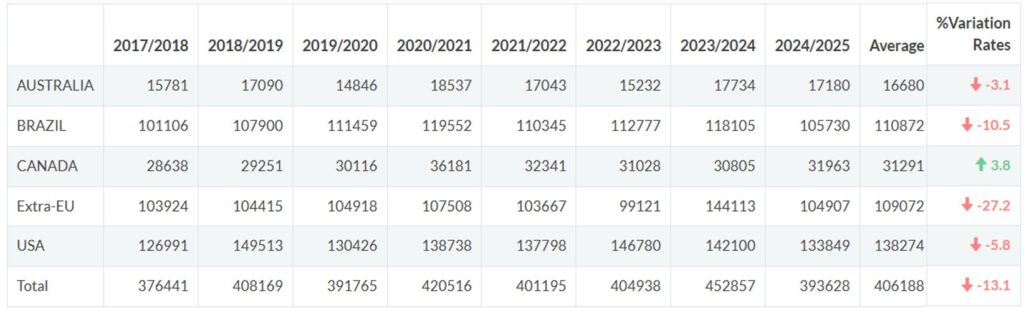
Table 2. Table olive imports from some of the main markets (September 2024 – July 2025) (volume in tonnes)
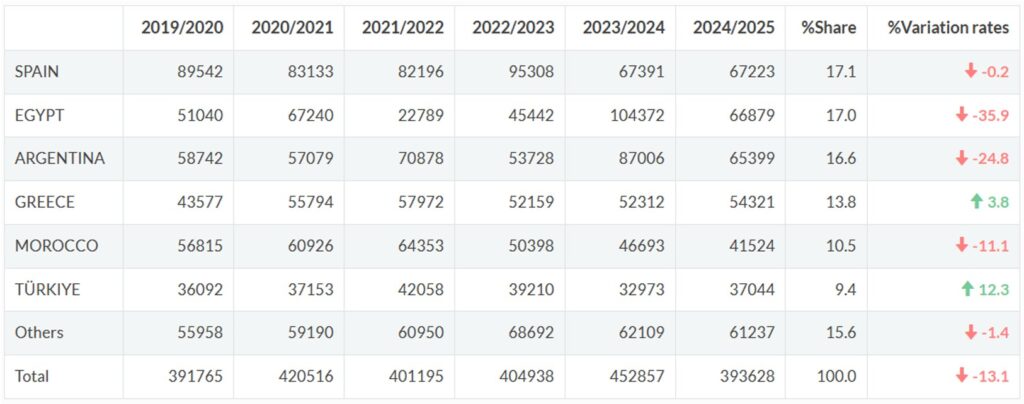
The main partner countries for these markets were Spain, Egypt, Argentina, Greece, Morocco and Türkiye.
 .
.
Table 3. Table olive imports by partner country (2019/20 – 2024/25) (September 2024 – July 2025) (tonnes)
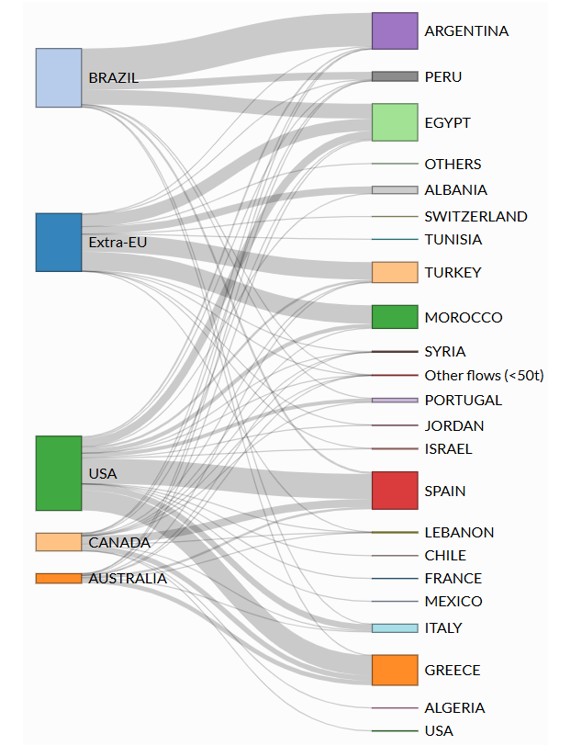
Graph 8. Table olive import flows between main importing markets and partner countries
Some of the data are subject to revision. Figures may change or be corrected without prior notice.