


Welcome to the International Olive Council (IOC), the world’s only intergovernmental organisation bringing together all stakeholders involved in the production and consumption of olive oil and table olives.
Here you will find a summary of the latest sector statistics, including an update on olive oil prices, trends in international trade in olive oil and table olives, and olive oil production prices.
Follow us and visit our website to stay up to date with the latest data. If you have any questions, feel free to contact us at iooc@internationaloliveoil.org.
Market situation
Trends in olive oil and table olive consumption
In the 2024/25 crop year, global olive oil consumption recovered, exceeding 3.2 million tonnes. Meanwhile, table olive consumption surpassed 3 million tonnes, representing an increase of 4% compared with the average of recent crop years.
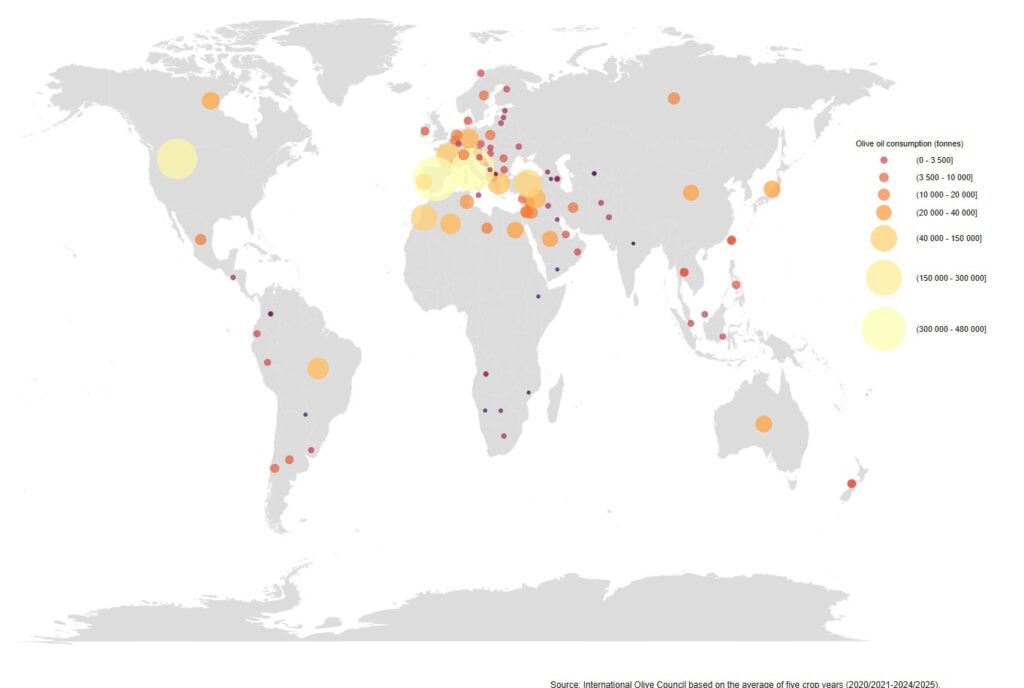
Graph 1 – Distribution of olive oil consumption in selected countries
Olive oil – Provisional 2024/25 crop year and estimate for 2025/26
According to official data and estimates from the IOC Executive Secretariat, global consumption could reach 3,248,000 tonnes in the 2025/26 crop year, representing an increase of 1.0% compared with the previous crop year.
The 2024/25 crop year, although still based on provisional data, recorded global consumption of 3,215,000 tonnes, representing an increase of 15.3% compared with 2023/24, that is, 426,500 tonnes more.
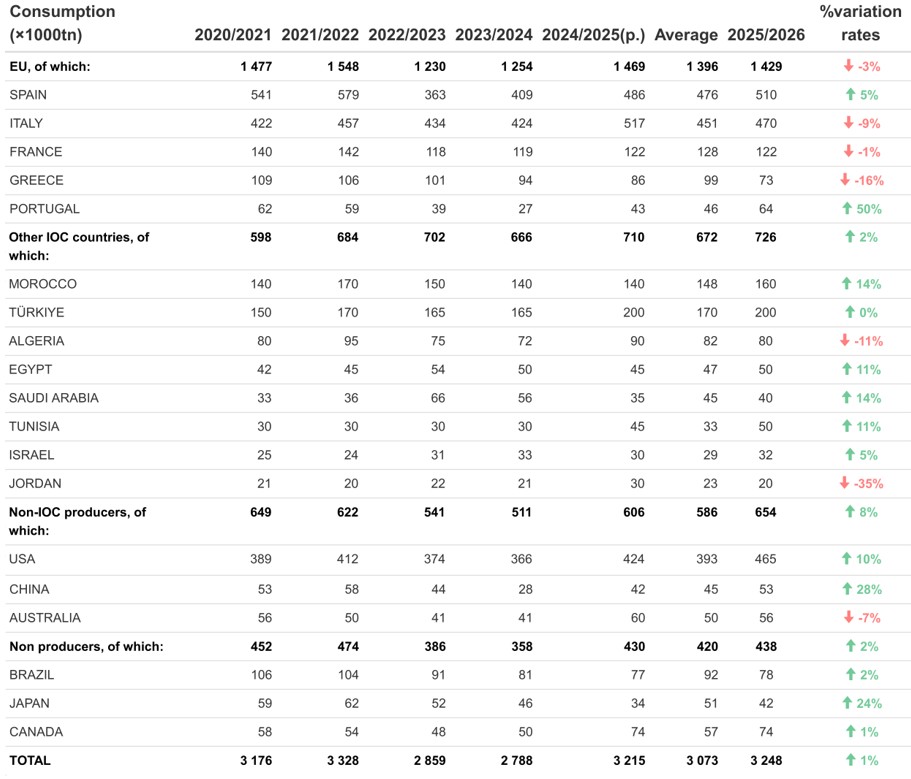
Table 1 – Olive oil consumption (×1000 t)
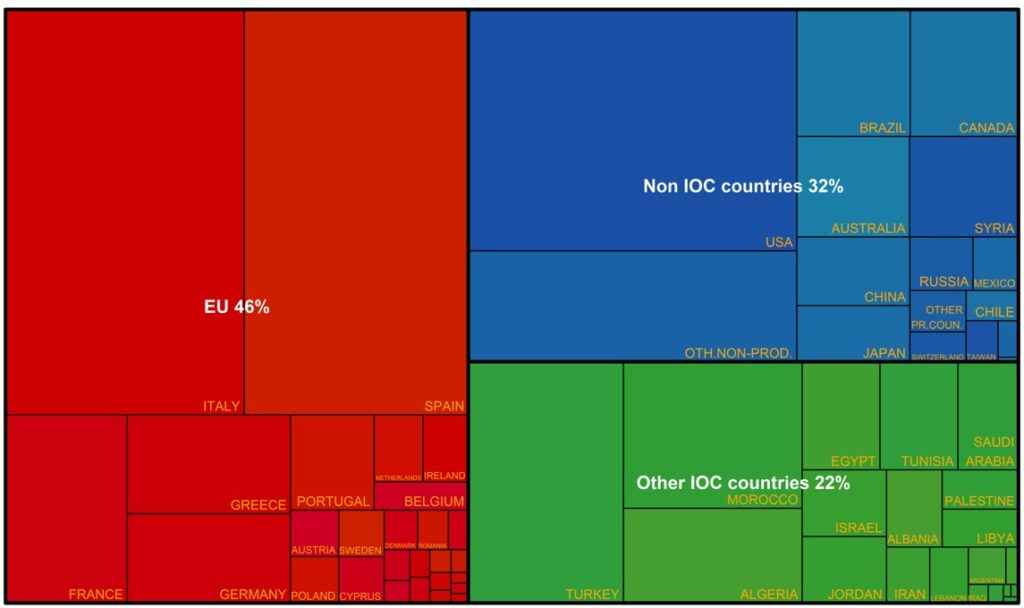
Graph 2 – Distribution of global olive oil consumption 2024/25
Compared with the 1990/91 crop year, global olive oil consumption has almost doubled. This growth has been driven mainly by non-IOC member countries and by other IOC member countries outside the European Union.
In contrast, consumption in the European Union has shown a downward trend since the 2004/05 crop year. The EU’s share of global consumption has declined from just over 70% in 2004/05 to around 45% in recent crop years. Nevertheless, this decrease has been offset by dynamic growth in other markets.
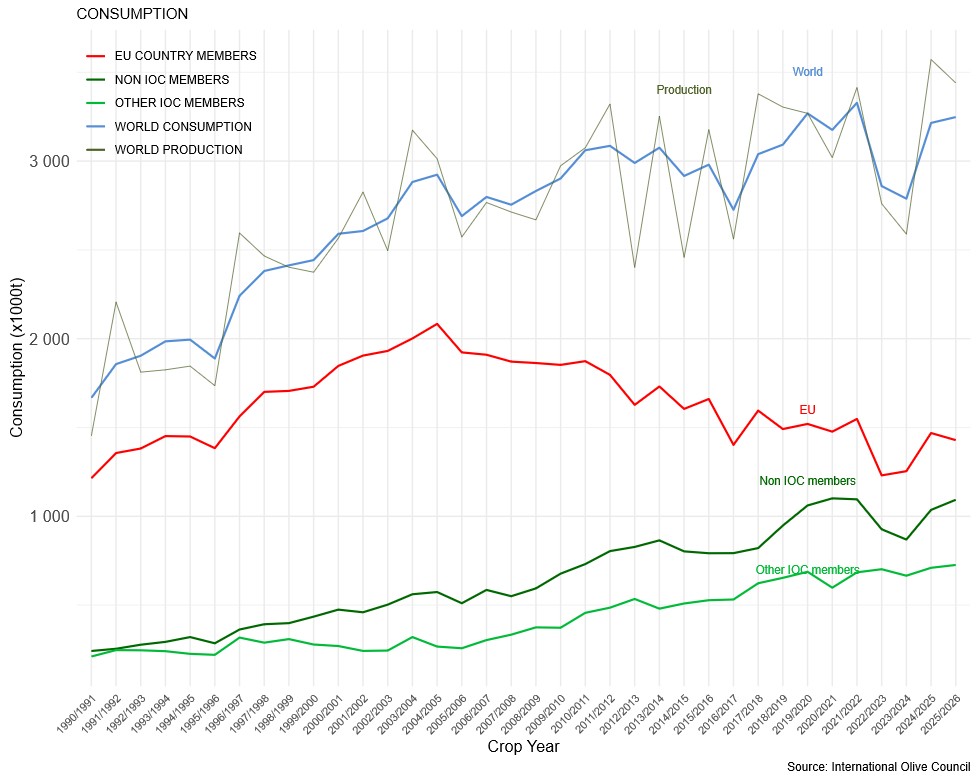
Graph 3 – Trends in olive oil consumption (×1000 t)
Table olives – Provisional 2024/25 crop year and estimate for 2025/26
Growth in table olive consumption has been observed mainly in the principal IOC member producing countries. In several of these countries, significant increases in production have been accompanied by substantial growth in domestic consumption.
Notable examples include:
- Egypt, where consumption increased from 11,000 tonnes in 1990/91 to 540,000 tonnes in 2024/25.
- Algeria, which rose from 14,000 tonnes to 267,500 tonnes over the same period.
- Türkiye, which increased its consumption from 110,000 tonnes to 395,000 tonnes.
Consumption is estimated at slightly above 3 million tonnes in the 2024/25 crop year and marginally lower in 2025/26.
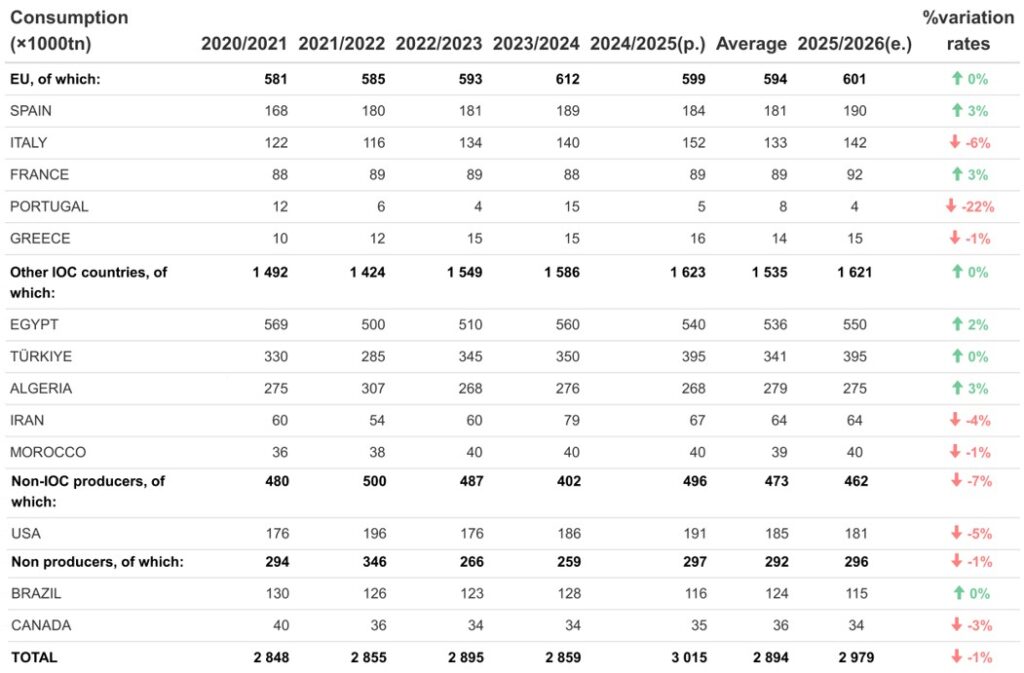
Table 2 – Table olive consumption (×1000 t)
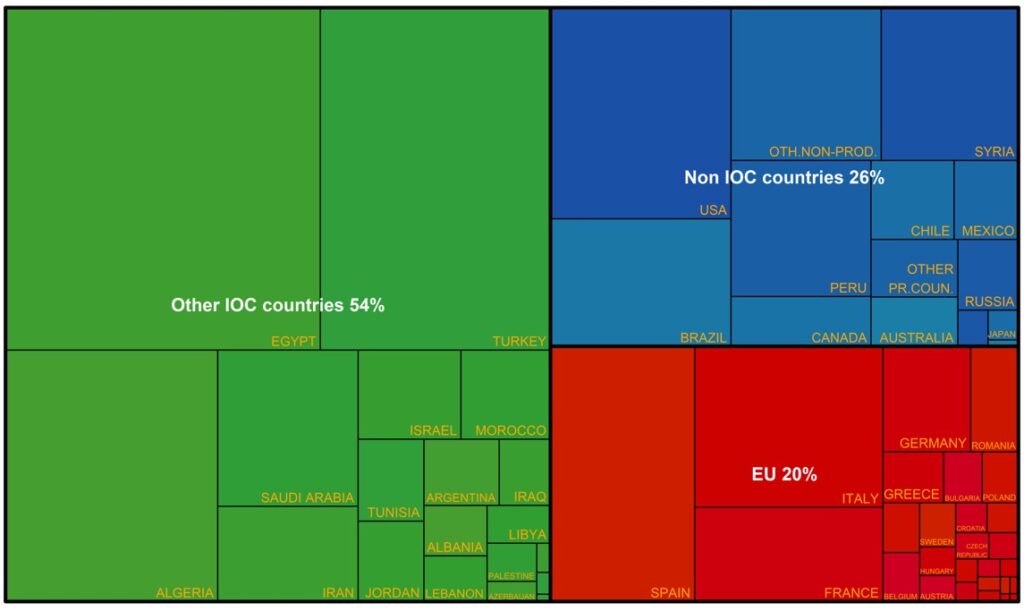
Graph 4 – Distribution of global table olive consumption 2024/25
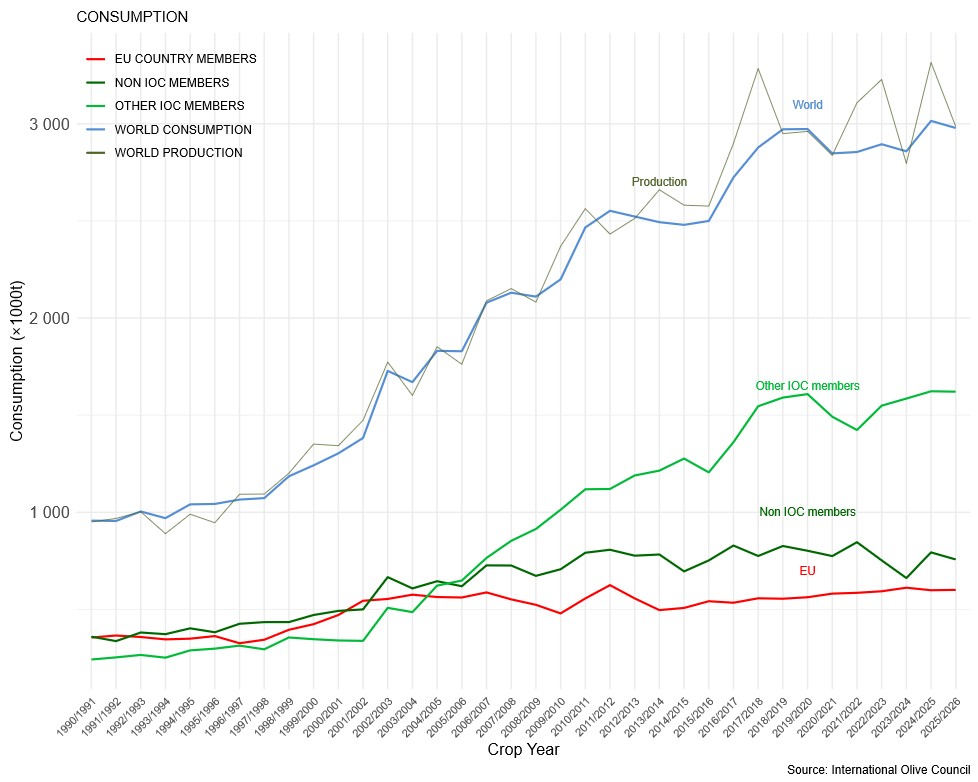
Graph 5 – Trends in table olive consumption (×1000 t)
Prices
With regard to extra virgin olive oil prices at origin:
- Jaén (Spain): in the week of 26 January to 1 February, €407/100 kg, representing a decrease of 2.5% compared with the same week of the previous crop year.
- Bari (Italy): in the same period, €650/100 kg (–30.9%).
- Chania (Greece): in the period from 1 December to 18 January, €430/100 kg (–5.5%).
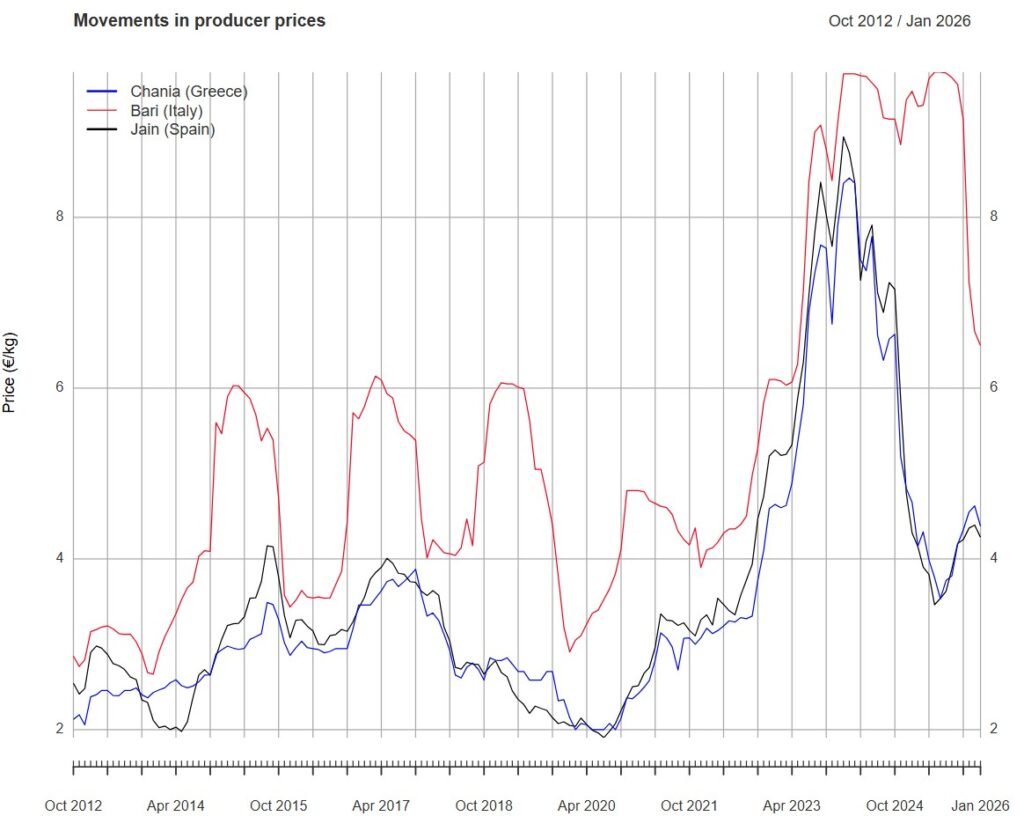
Graph 6 – Trends in monthly extra virgin olive oil prices at origin
Imports
Olive oil
Olive oil imports in some of the main markets, covering the period October–November of the 2025/26 crop year, increased by 15.1% compared with the same period of the 2024/25 crop year.
A general recovery in imported volumes has been observed in most of these markets, with the exception of China and the United States.
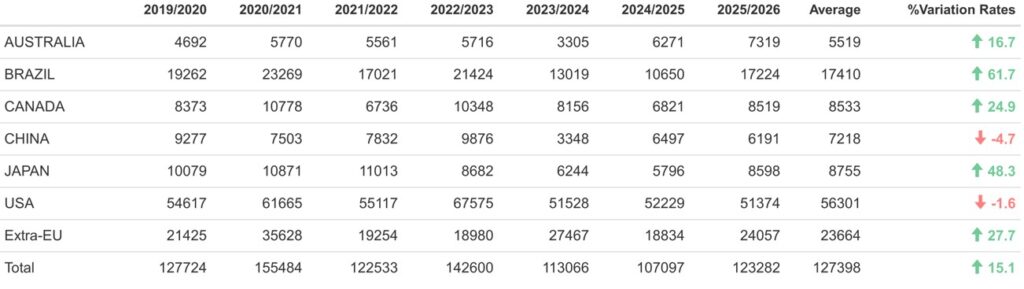
Table 3 – Olive oil imports in selected major markets (October–November 2025, volume in tonnes)
Table olives
Table olive imports in some of the main markets during the 2025/26 crop year, covering the period September–November 2025, increased by 7.9% compared with the same period of the previous crop year.
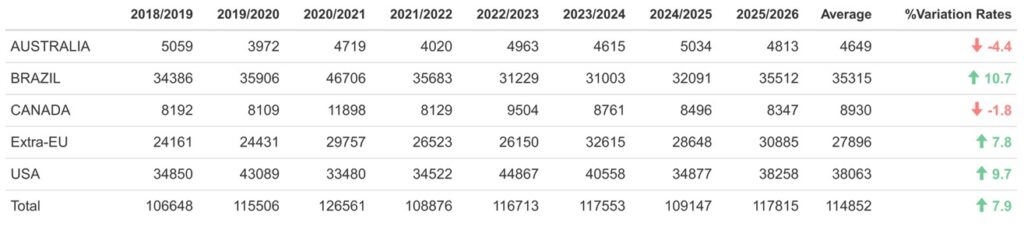
Table 4 – Table olive imports in selected major markets (September–November 2025, volume in tonnes)
* Some of the data presented are subject to revision. Figures may be modified or corrected without prior notice.